Fig. A.9
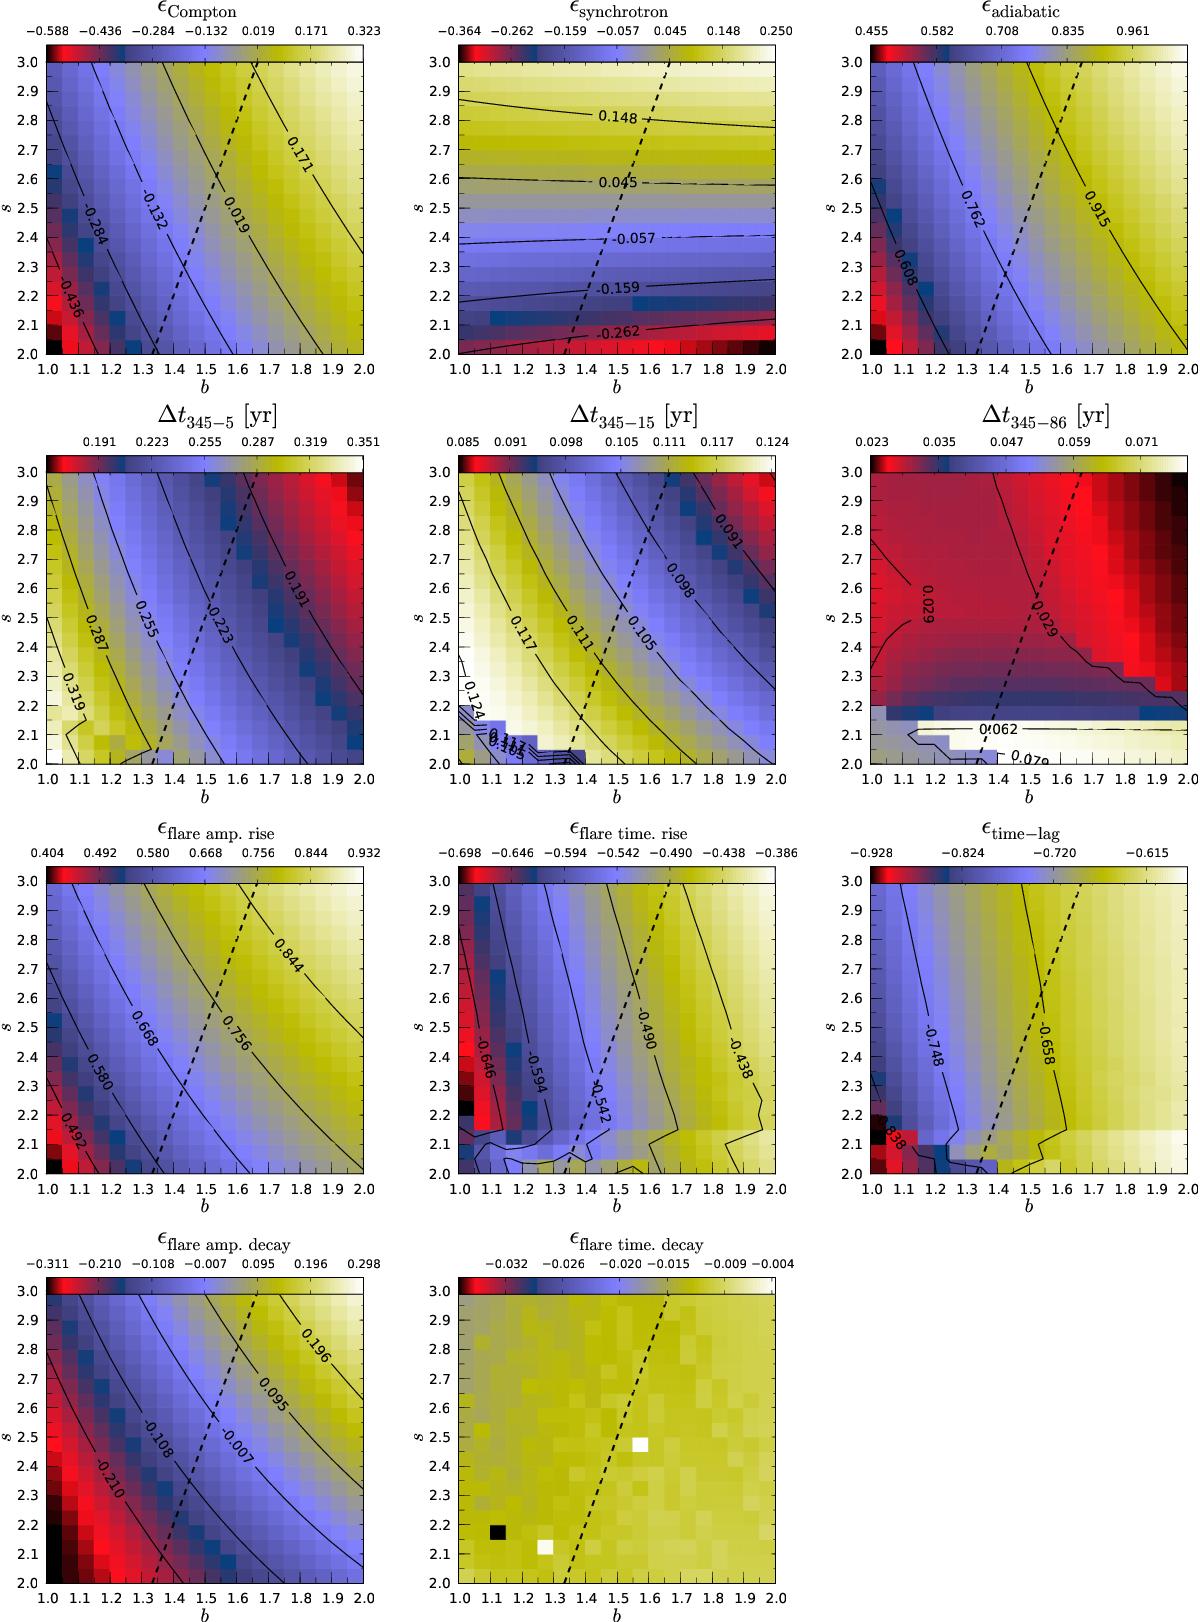
Modified Compton stage model using d = 0. The top row shows the slopes for the different energy loss stages from left to right: compton, synchrotron, and adiabatic stage. The delay between selected frequencies with respect to 345 GHz in years is plotted in the second row from left to right: delay to 5 GHz, delay to 15 GHz and delay to 86 GHz. The third row presents the frequency dependent light curve parameters obtained from the rising edge of the light curve from left to right: flare amplitude, flare time scale and cross frequency delay. The bottom row shows the exponent for the flare amplitude and the flare time scale as derived from the decaying edge of the light curve. The black dashed line corresponds to a constant uB/ue ratio with distance (beq = (s + 2)/3)), i.e. to the left of this line the jet flow tends to be magnetically dominated with distance and to the right the jet tends to be particle energy dominated with distance.
Current usage metrics show cumulative count of Article Views (full-text article views including HTML views, PDF and ePub downloads, according to the available data) and Abstracts Views on Vision4Press platform.
Data correspond to usage on the plateform after 2015. The current usage metrics is available 48-96 hours after online publication and is updated daily on week days.
Initial download of the metrics may take a while.