Fig. A.3
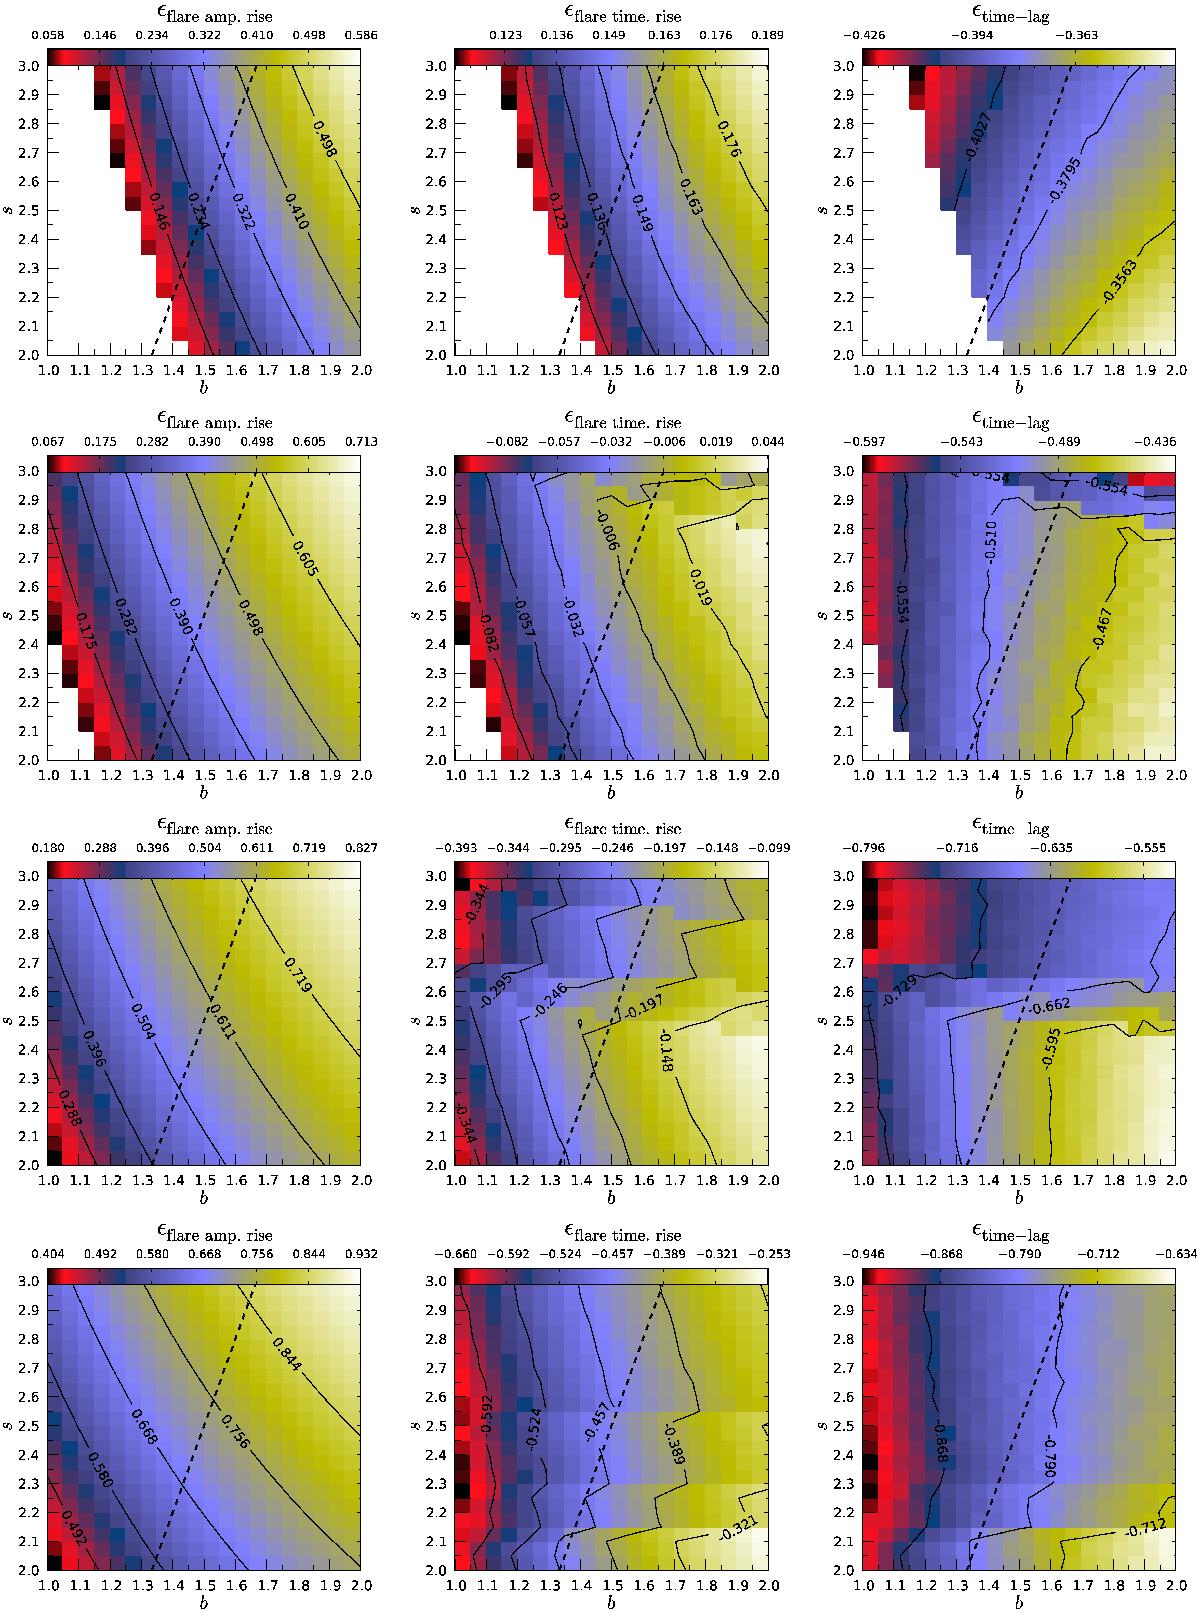
Parameter space plots for the variation of frequency dependent single-dish light curve parameters obtained from the rising edge of the light curves as function of b and s while keeping the d parameter fixed. The columns show from left to right the exponent for the variability amplitude, ϵflare amp., the exponent for the variability time scale, ϵflare time scale, and the exponent for the time lag, ϵdelay. The exponent for the evolution of the Doppler factor, d, is from top to bottom d = −0.45, d = −0.30, d = −0.15, and d = 0. The black dashed line corresponds to a constant uB/ue ratio with distance (beq = (s + 2)/3)), i.e. to the left of this line the jet flow tends to be magnetically dominated with distance and to the right the jet tends to be particle energy dominated with distance.
Current usage metrics show cumulative count of Article Views (full-text article views including HTML views, PDF and ePub downloads, according to the available data) and Abstracts Views on Vision4Press platform.
Data correspond to usage on the plateform after 2015. The current usage metrics is available 48-96 hours after online publication and is updated daily on week days.
Initial download of the metrics may take a while.