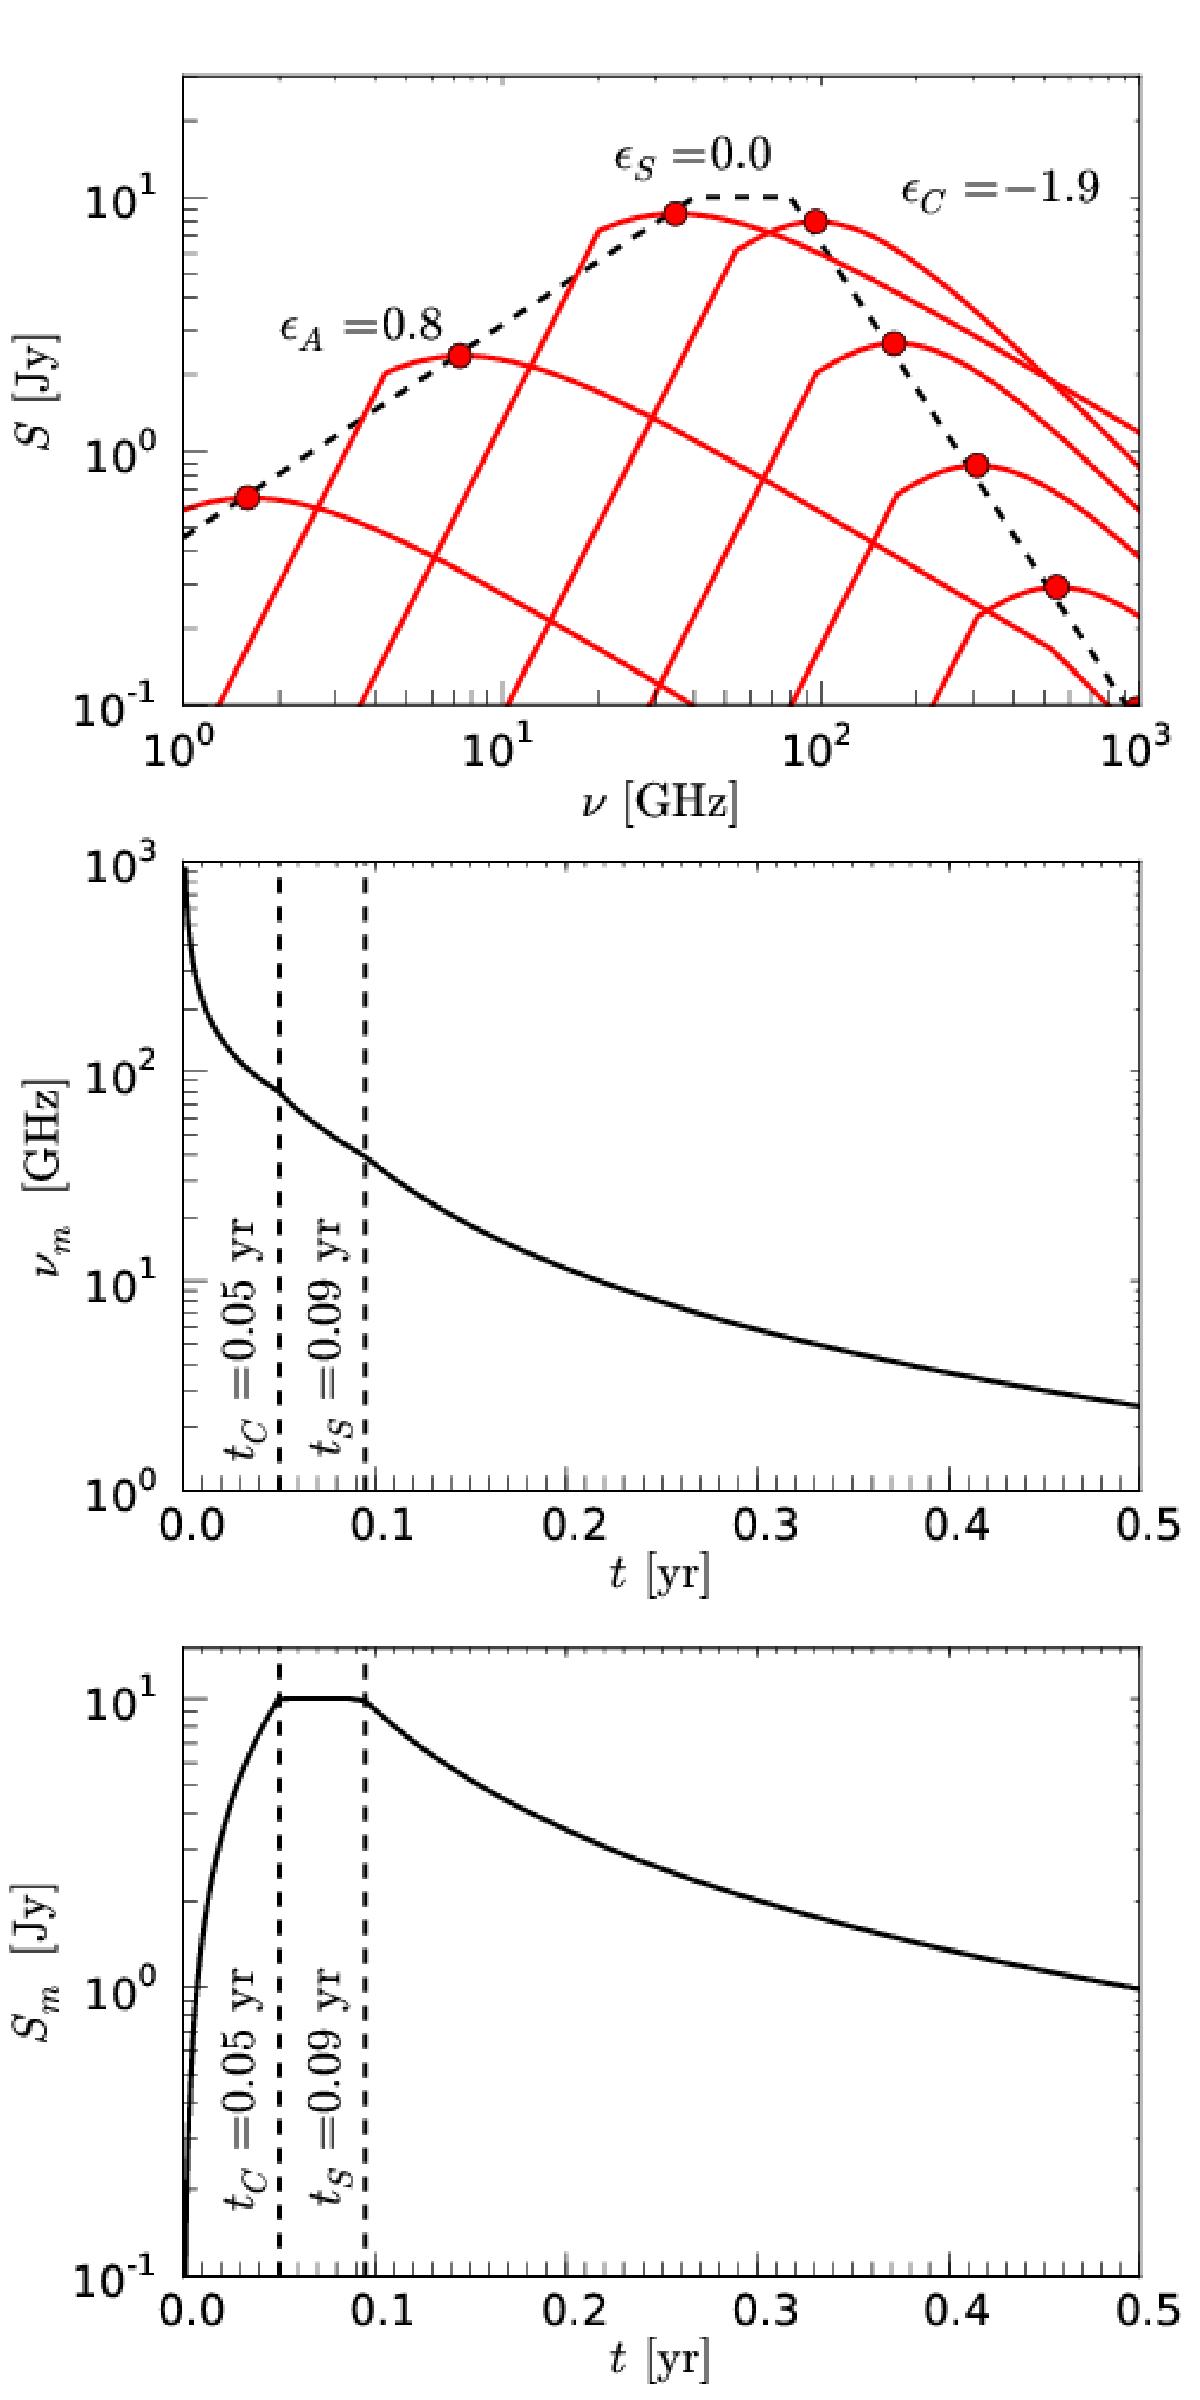
Fig. 1

Evolution of the turnover frequency, νm, and the turnover flux density, Sm, for a model with b = 1.5, s = 2.5, ρ = 1, k = 3.0, and d = 0. The top panel shows the evolution of the flare in the (νm–Sm) plane (the time evolution is from the bottom right, to the centre and to the bottom left). The black dashed line indicates the path along which νm and Sm (red dots) evolve. The slopes of the different stages are given in the plot. The red lines correspond to SSA spectra computed for different times (position along the spectral evolution path). The middle panel shows the temporal evolution of νm, and the bottom panel displays the temporal evolution of Sm.
Current usage metrics show cumulative count of Article Views (full-text article views including HTML views, PDF and ePub downloads, according to the available data) and Abstracts Views on Vision4Press platform.
Data correspond to usage on the plateform after 2015. The current usage metrics is available 48-96 hours after online publication and is updated daily on week days.
Initial download of the metrics may take a while.


