Free Access
Fig. 8
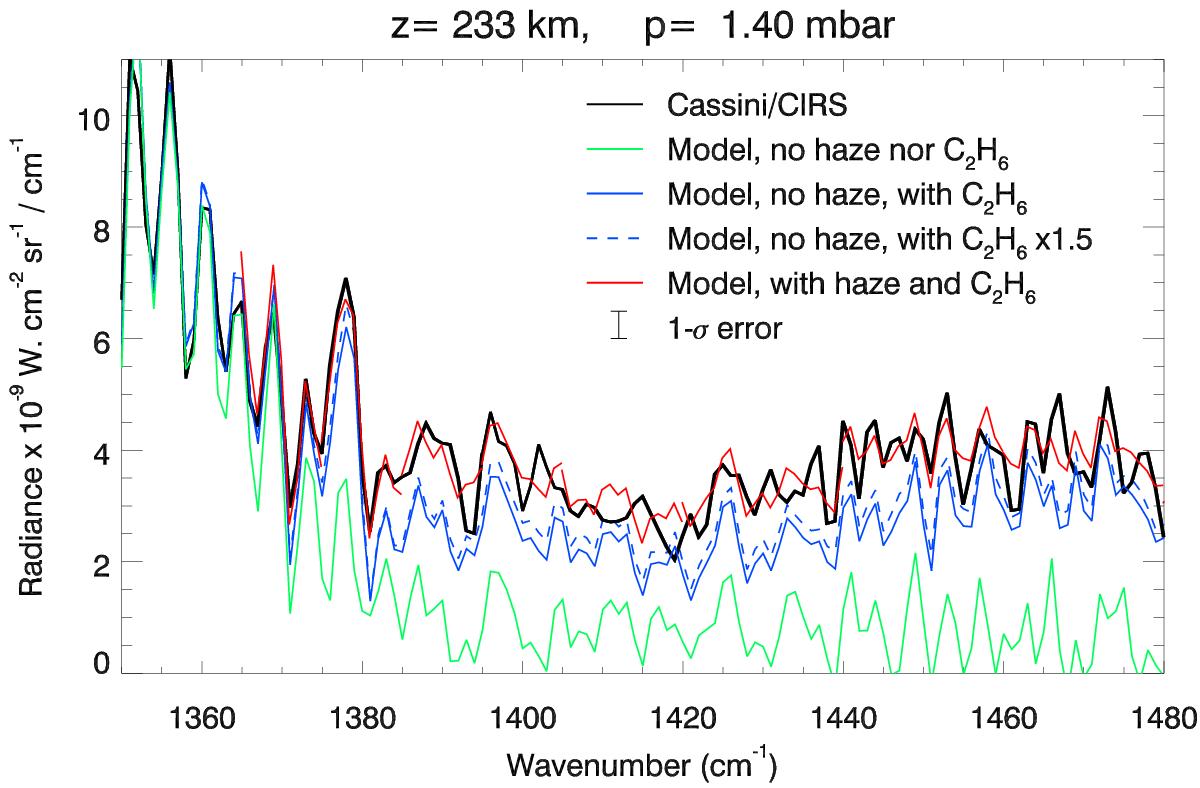
Cassini/CIRS spectrum acquired at 80°S (in black) compared to best-fit spectra, obtained by retrieving haze opacity profiles (in red) or assuming no haze opacity (in blue). A synthetic spectrum without haze or C2H6 is also shown in green. A typical 1σ measurement error due to noise is indicated.
Current usage metrics show cumulative count of Article Views (full-text article views including HTML views, PDF and ePub downloads, according to the available data) and Abstracts Views on Vision4Press platform.
Data correspond to usage on the plateform after 2015. The current usage metrics is available 48-96 hours after online publication and is updated daily on week days.
Initial download of the metrics may take a while.