Fig. 10
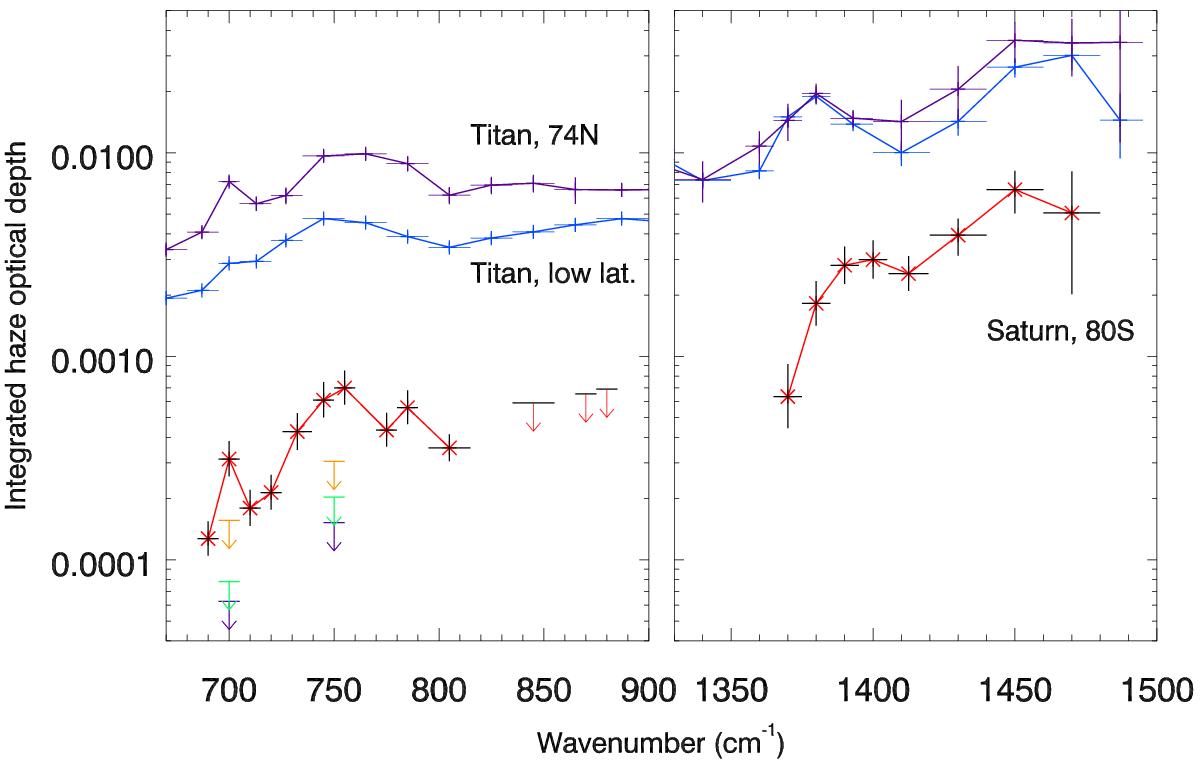
Spectrum of the haze opacity integrated between 3 and 0.1 mbar at 80°S (Saturn, in red). Upper limits at 700 and 750 cm-1 are shown for 40°N, 0°, and 35°S (purple, green, and orange arrows). For comparison, Titan’s haze opacity integrated between 1.7 and 0.7 mbar, derived at 74°N and at low latitudes, are shown as purple and blue lines (Vinatier et al. 2012).
Current usage metrics show cumulative count of Article Views (full-text article views including HTML views, PDF and ePub downloads, according to the available data) and Abstracts Views on Vision4Press platform.
Data correspond to usage on the plateform after 2015. The current usage metrics is available 48-96 hours after online publication and is updated daily on week days.
Initial download of the metrics may take a while.