Fig. 10
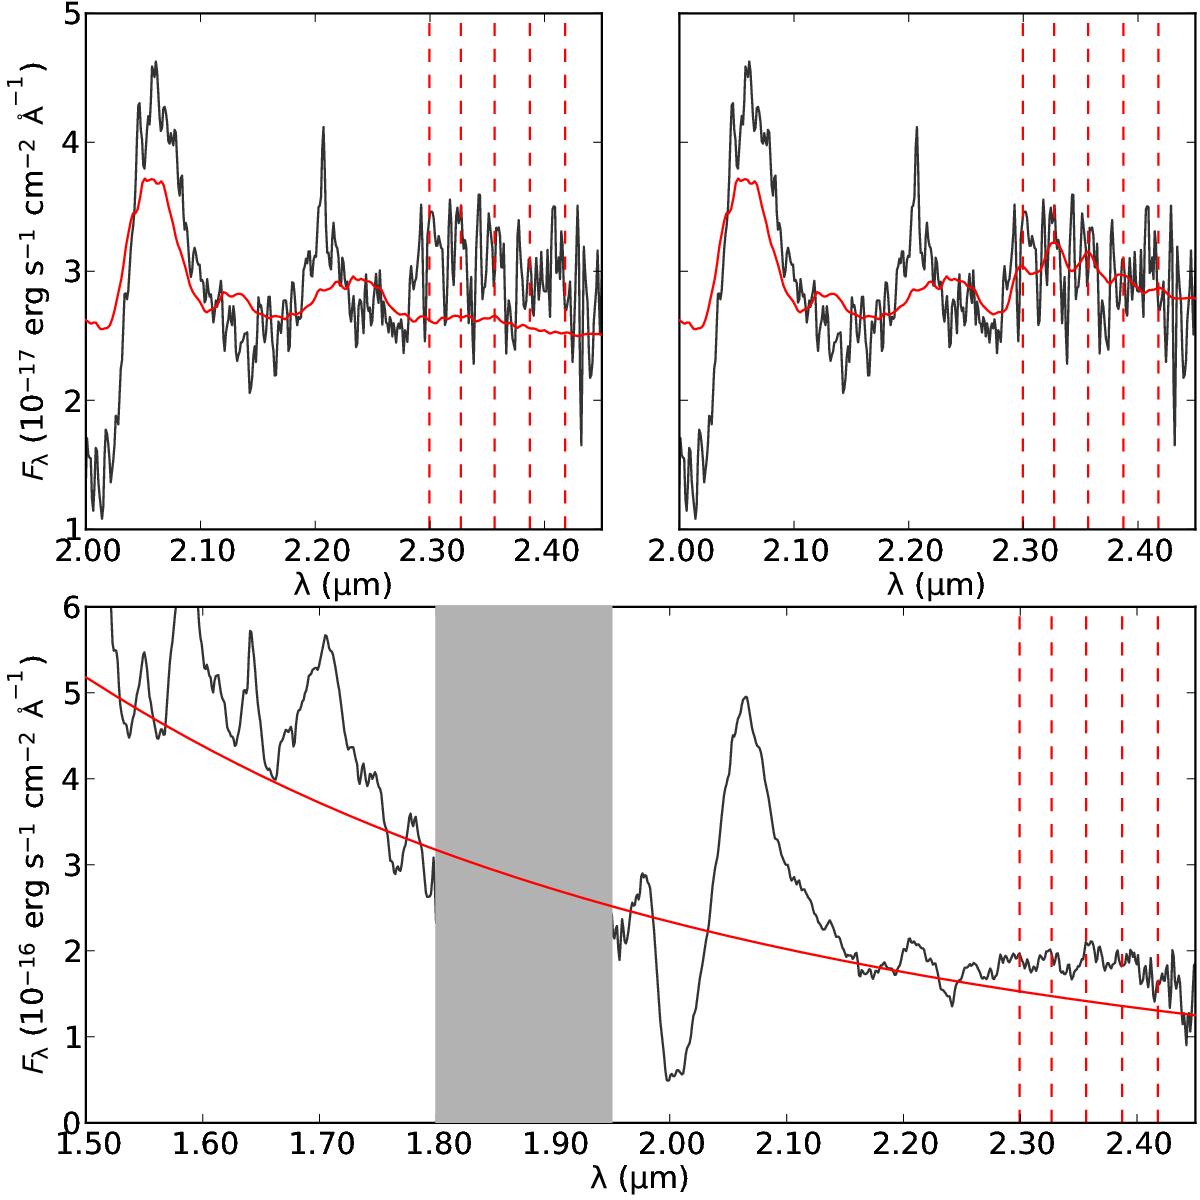
Upper left panel: observed (black solid line) and preferred steady-state NLTE model (red solid line) K-band spectra at days 206 and 200, respectively. Upper right panel: the same, but with the CO LTE model emission added to the steady-state NLTE model spectra. The CO overtone band heads have been marked by red dashed lines and the steady-state NLTE model spectra flux calibrated with the observed K-band flux at day 206. Lower panel: observed (black solid line) H- and K-band spectrum at day 89 as compared to a blackbody fit to the continuum (red solid line).
Current usage metrics show cumulative count of Article Views (full-text article views including HTML views, PDF and ePub downloads, according to the available data) and Abstracts Views on Vision4Press platform.
Data correspond to usage on the plateform after 2015. The current usage metrics is available 48-96 hours after online publication and is updated daily on week days.
Initial download of the metrics may take a while.