Free Access
Fig. 6
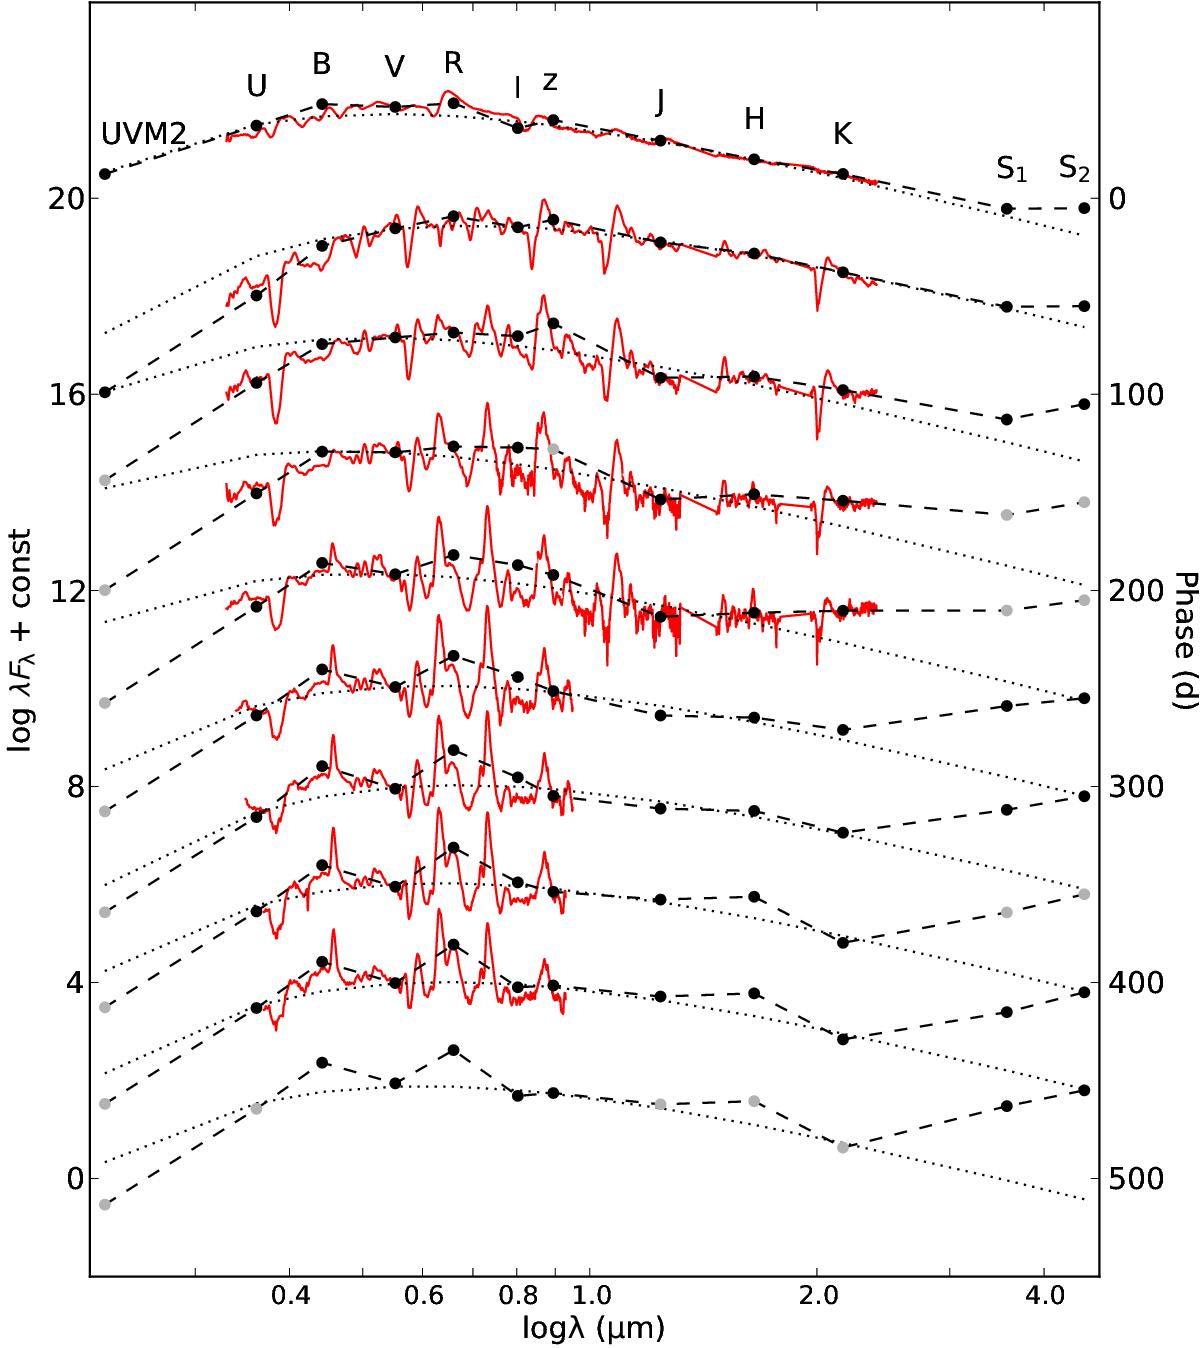
Evolution of the SED (black dots and dashed lines) before day 500, overplotted with blackbody fits to the V, I, J, H, and K photometry (black dotted lines) and the observed (interpolated; Sect. 3.1) spectra (red solid lines). Fluxes based on extrapolations or interpolations over more than 25 days are shown in shaded colour.
Current usage metrics show cumulative count of Article Views (full-text article views including HTML views, PDF and ePub downloads, according to the available data) and Abstracts Views on Vision4Press platform.
Data correspond to usage on the plateform after 2015. The current usage metrics is available 48-96 hours after online publication and is updated daily on week days.
Initial download of the metrics may take a while.