Free Access
Fig. 5
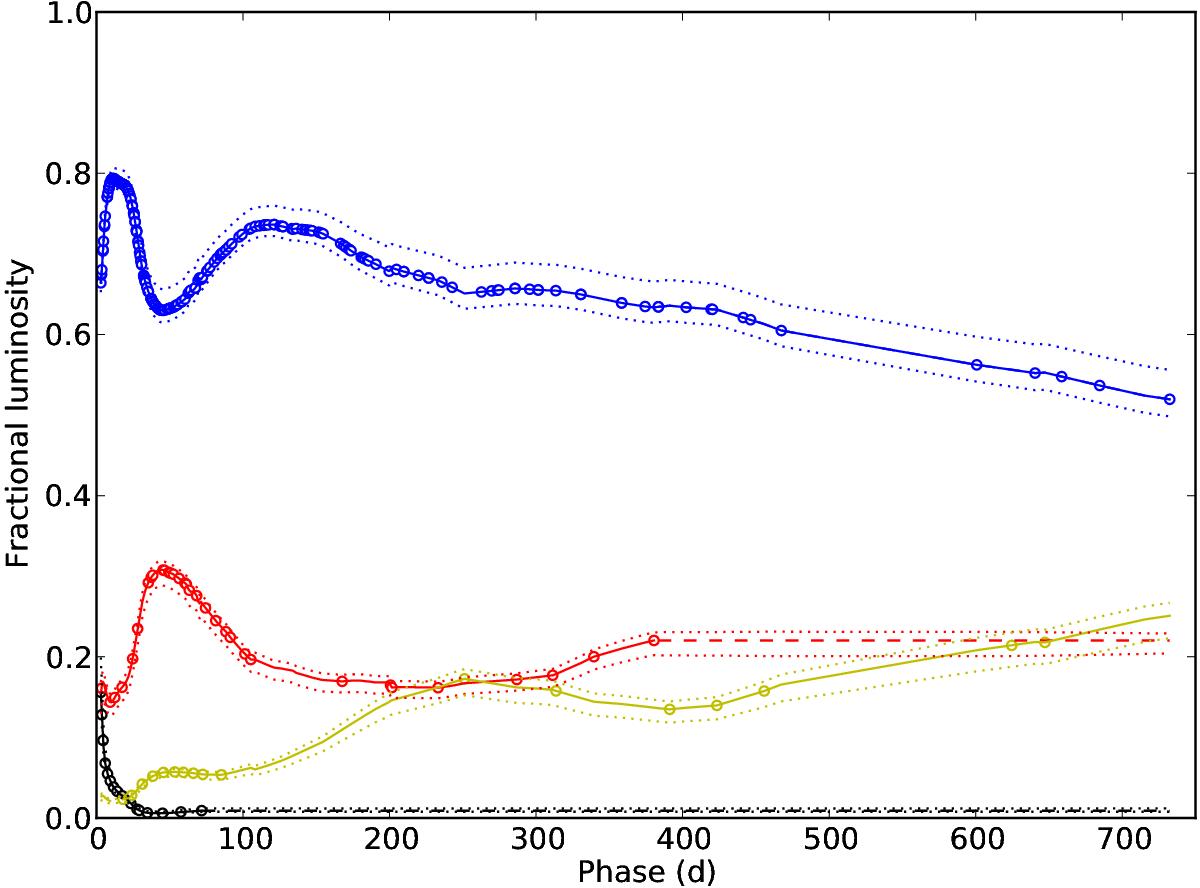
Fractional UV (black dots), optical (blue dots), NIR (red dots), and MIR (yellow dots) luminosity before day 750 for SN 2011dh. Interpolations and extrapolations are shown as solid and dashed lines, respectively. The upper and lower error bars for the systematic error arising from extinction (dotted lines) are also shown.
Current usage metrics show cumulative count of Article Views (full-text article views including HTML views, PDF and ePub downloads, according to the available data) and Abstracts Views on Vision4Press platform.
Data correspond to usage on the plateform after 2015. The current usage metrics is available 48-96 hours after online publication and is updated daily on week days.
Initial download of the metrics may take a while.