Free Access
Fig. 3
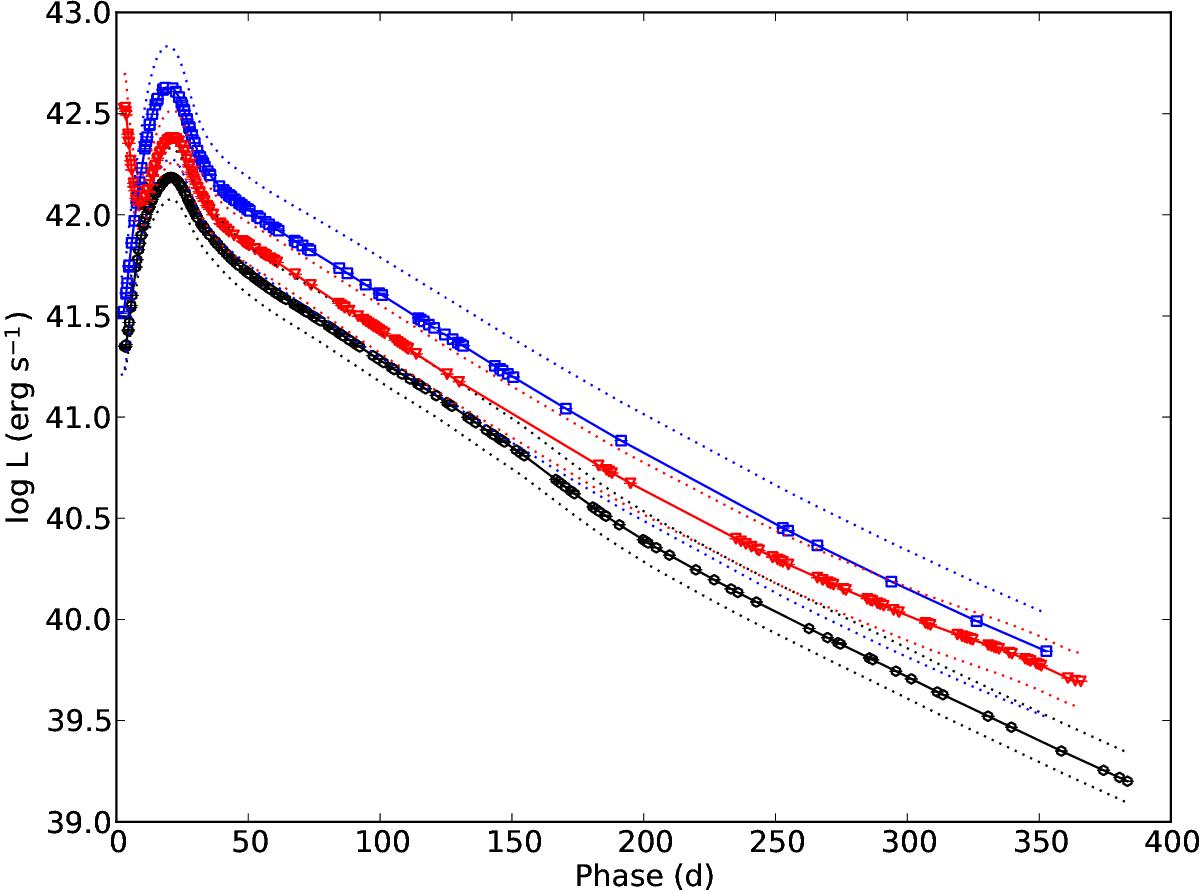
Optical-to-NIR pseudo-bolometric lightcurve before day 400 for SNe 2011dh (black circles and solid line), 1993J (red triangles and solid line), and 2008ax (blue squares and solid line). The upper and lower error bars for the systematic error arising from extinction and distance (dotted lines) are also shown.
Current usage metrics show cumulative count of Article Views (full-text article views including HTML views, PDF and ePub downloads, according to the available data) and Abstracts Views on Vision4Press platform.
Data correspond to usage on the plateform after 2015. The current usage metrics is available 48-96 hours after online publication and is updated daily on week days.
Initial download of the metrics may take a while.