Fig. 7
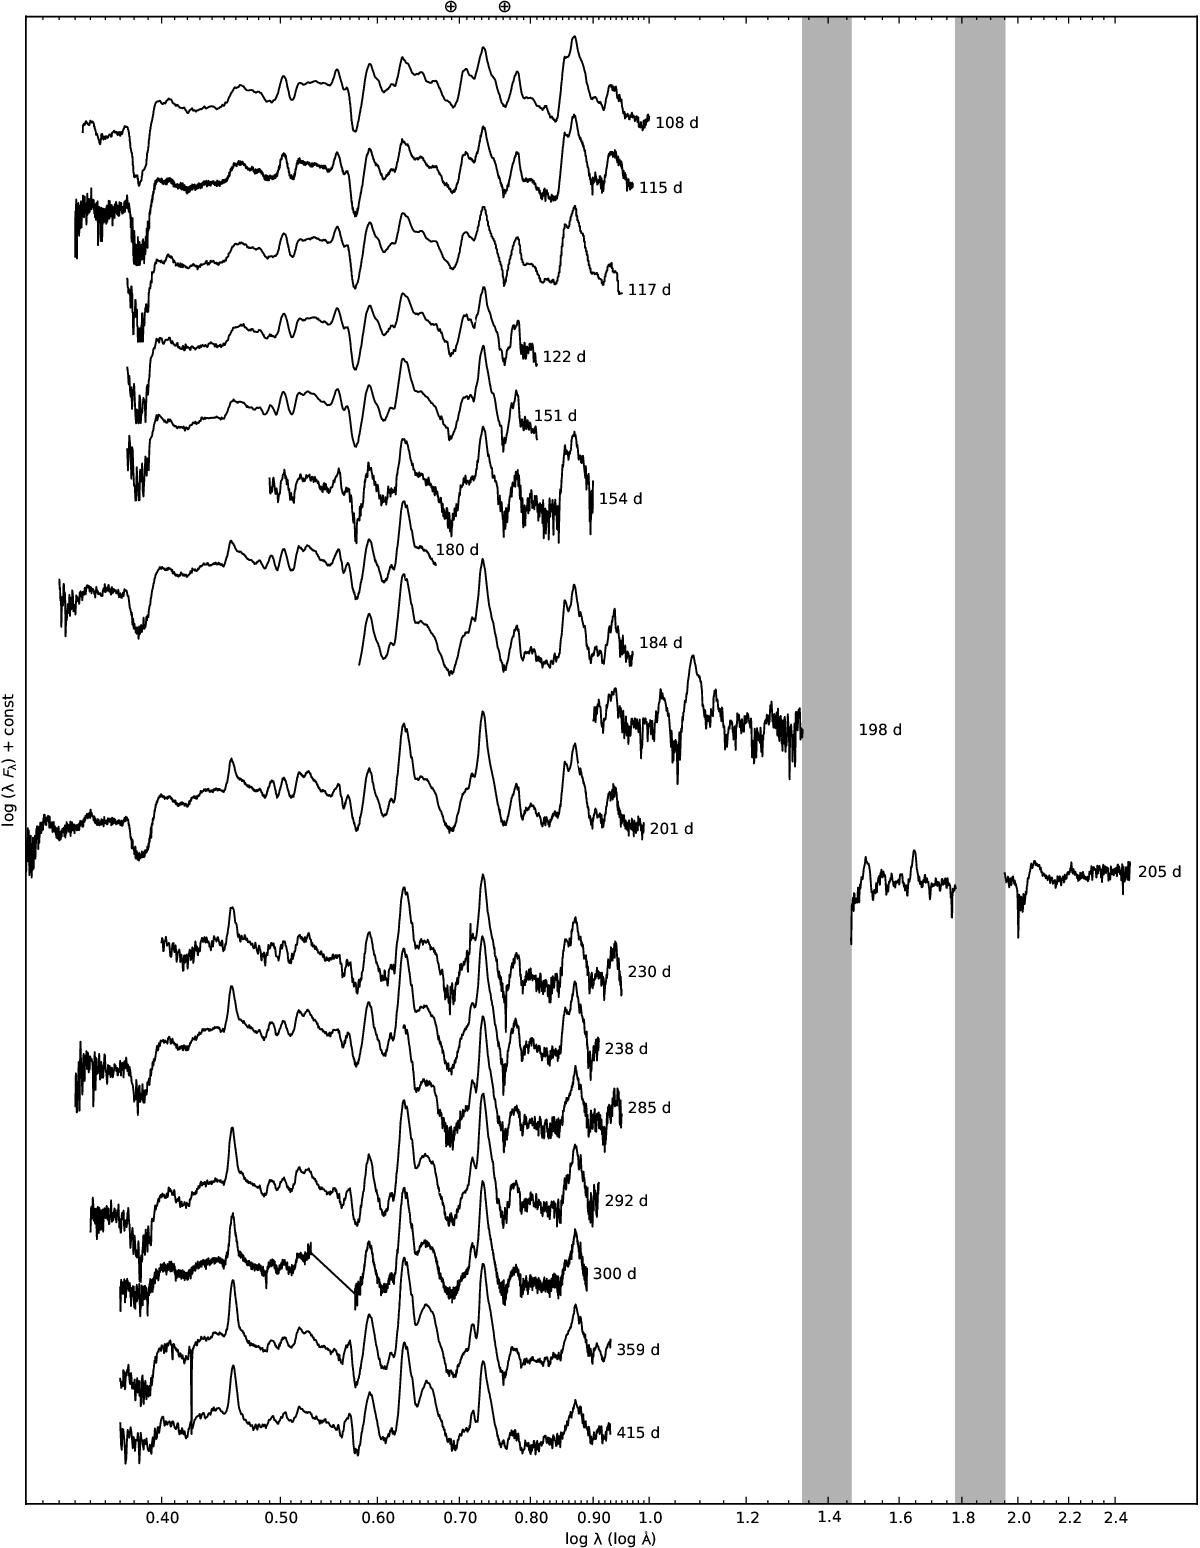
Sequence of the observed late-time (day 100−415) spectra for SN 2011dh. Spectra obtained on the same night using the same telescope and instrument have been combined and each spectra have been labelled with the phase of the SN. Telluric absorption bands are marked with a ⊕ symbol in the optical and are shown as grey regions in the NIR.
Current usage metrics show cumulative count of Article Views (full-text article views including HTML views, PDF and ePub downloads, according to the available data) and Abstracts Views on Vision4Press platform.
Data correspond to usage on the plateform after 2015. The current usage metrics is available 48-96 hours after online publication and is updated daily on week days.
Initial download of the metrics may take a while.