Fig. 23
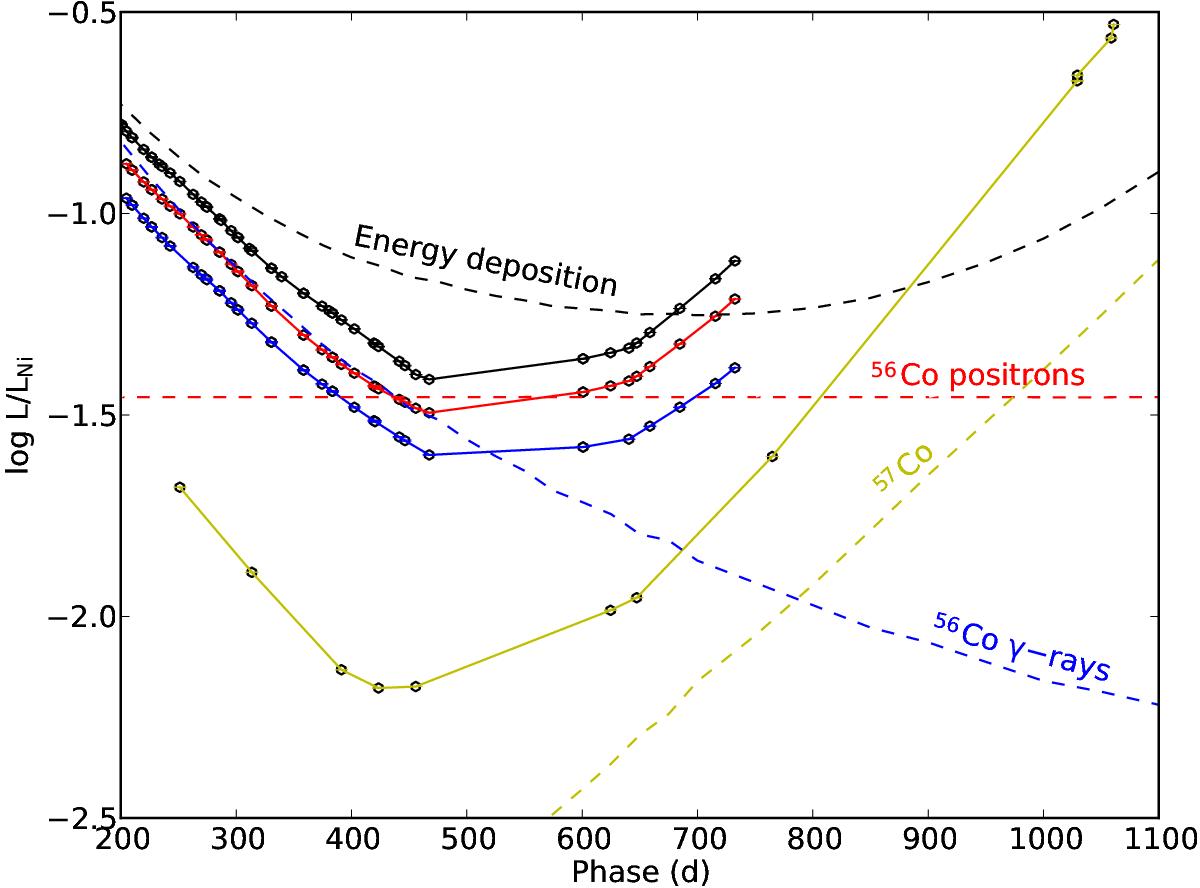
Optical-to-MIR (black dots), optical-plus-MIR (red dots), optical (blue dots), and MIR (yellow dots) pseudo-bolometric lightcurves after day 200, compared to the bolometric lightcurve (black dashed line), deposited 56Coγ-ray (blue dashed line) and positron (red dashed line) luminosity, and deposited 57Co luminosity (yellow dashed line) for the preferred steady-state NLTE model (12F). The lightcurves have been normalized to the radioactive decay chain luminosity of 0.075 M⊙ of 56Ni.
Current usage metrics show cumulative count of Article Views (full-text article views including HTML views, PDF and ePub downloads, according to the available data) and Abstracts Views on Vision4Press platform.
Data correspond to usage on the plateform after 2015. The current usage metrics is available 48-96 hours after online publication and is updated daily on week days.
Initial download of the metrics may take a while.