Fig. 22
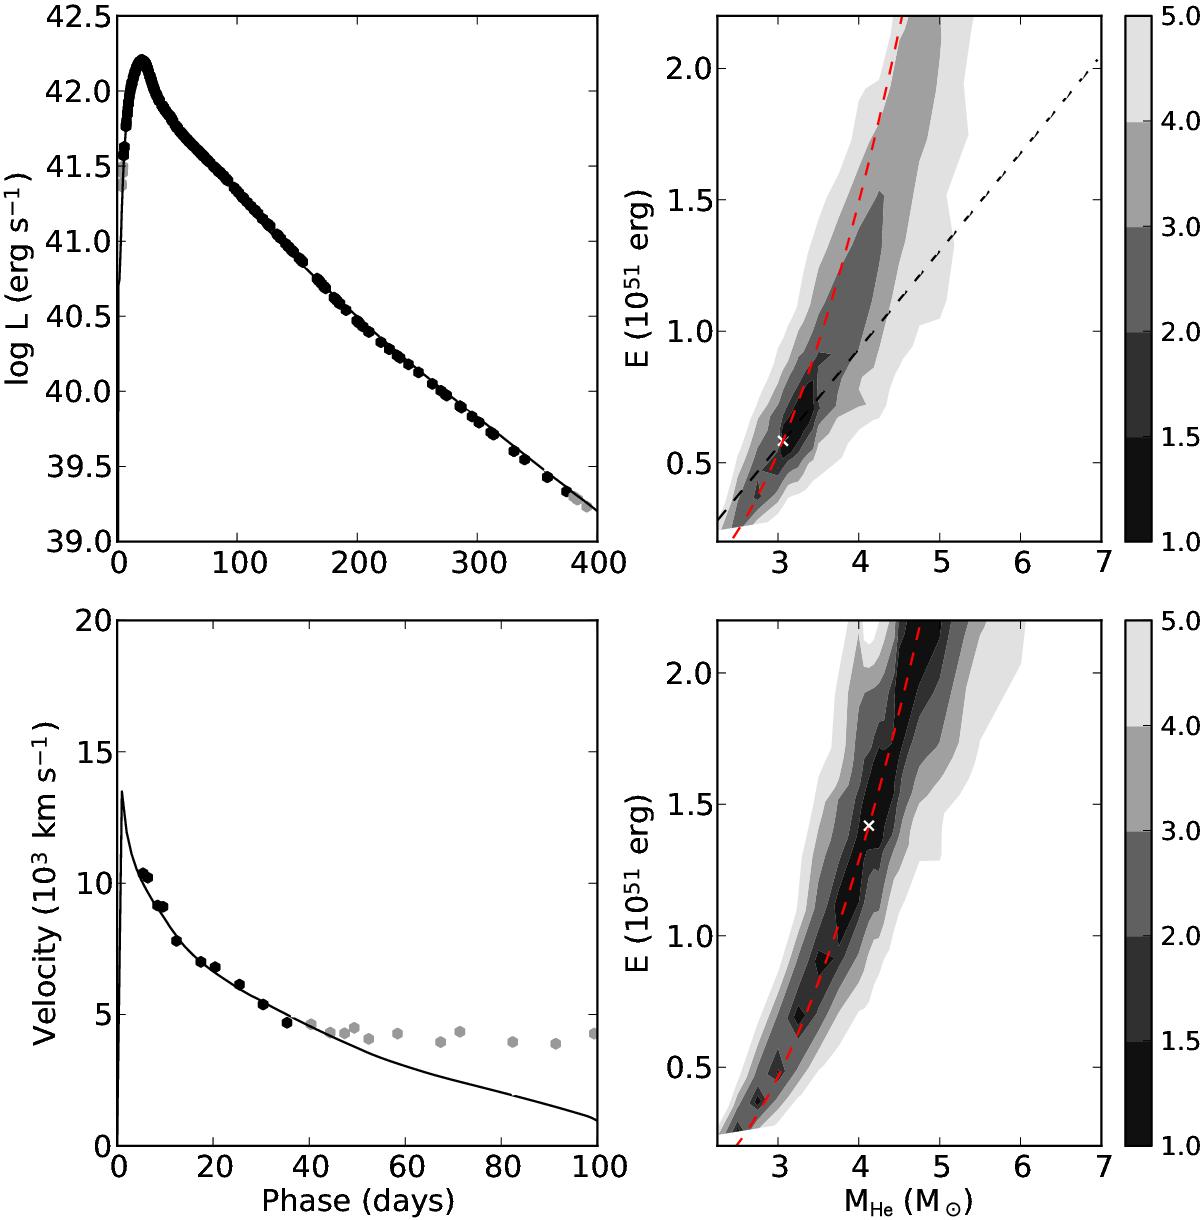
Left panels: optical-to-MIR pseudo-bolometric lightcurve (upper left panel) and photospheric velocities (lower left panel) for the best-fit model (solid line) compared to observations (circles), where the photospheric velocities have been estimated from the absorption minimum of the Fe ii 5169 Å line. Observations not included in the fit are shown in grey. Right panels: contour plots showing the (grey-scale coded) standard deviation in the fit, normalized to that of the best-fit model, projected onto the E−MHe plane for the case where the photospheric velocities were used (upper right panel) and not used (lower right panel). We also show the constraints Mej/E = const. (blue line) and ![]() /E = const. (red line) provided by the photospheric velocities and the bolometric lightcurve, respectively (E15).
/E = const. (red line) provided by the photospheric velocities and the bolometric lightcurve, respectively (E15).
Current usage metrics show cumulative count of Article Views (full-text article views including HTML views, PDF and ePub downloads, according to the available data) and Abstracts Views on Vision4Press platform.
Data correspond to usage on the plateform after 2015. The current usage metrics is available 48-96 hours after online publication and is updated daily on week days.
Initial download of the metrics may take a while.