Fig. 21
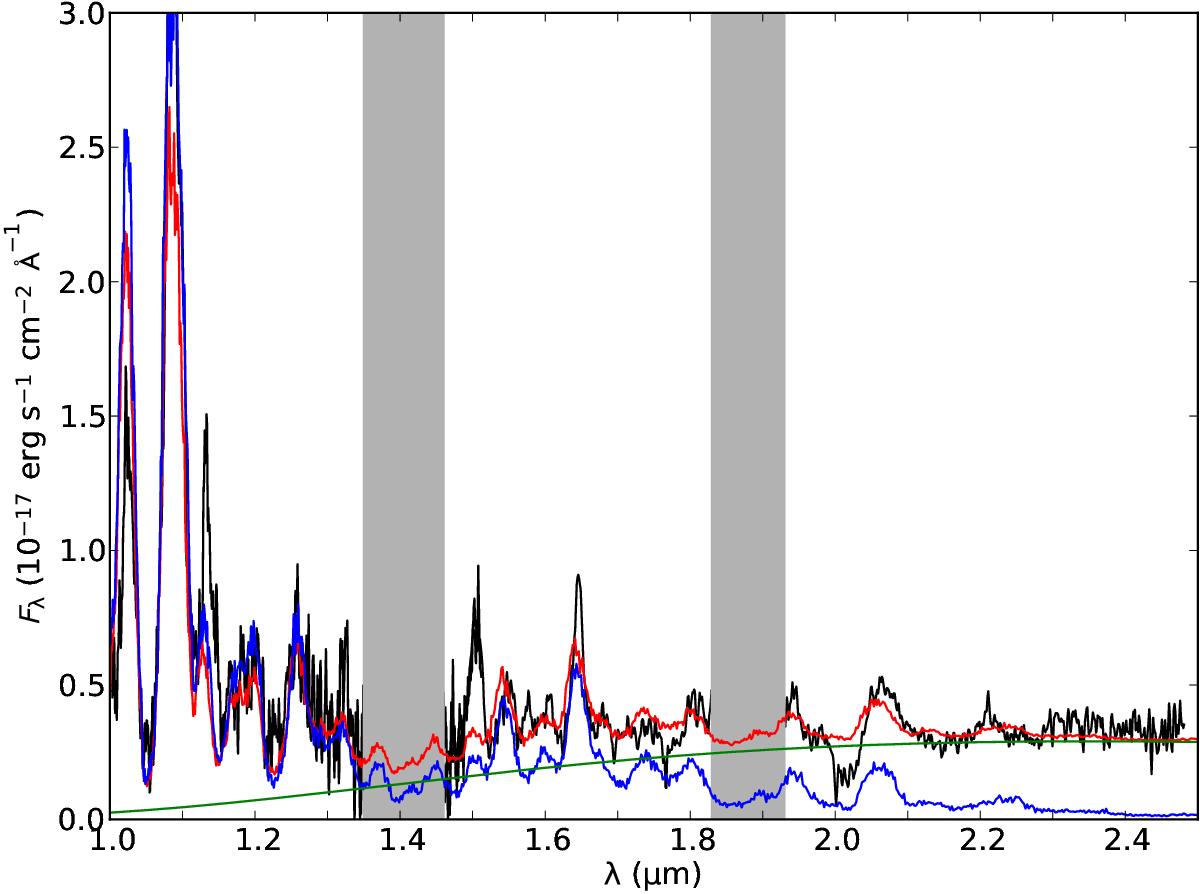
Observed zJ and HK spectra at days 198 and 206 (black) compared to NIR spectra for the preferred model (12F, red) and model 12E (blue), which differs only in that τdust = 0. The observed spectra were flux calibrated with the interpolated observed J, H, and K magnitudes at day 200 and we also show the dust emission component for the preferred model (green).
Current usage metrics show cumulative count of Article Views (full-text article views including HTML views, PDF and ePub downloads, according to the available data) and Abstracts Views on Vision4Press platform.
Data correspond to usage on the plateform after 2015. The current usage metrics is available 48-96 hours after online publication and is updated daily on week days.
Initial download of the metrics may take a while.