Fig. 20
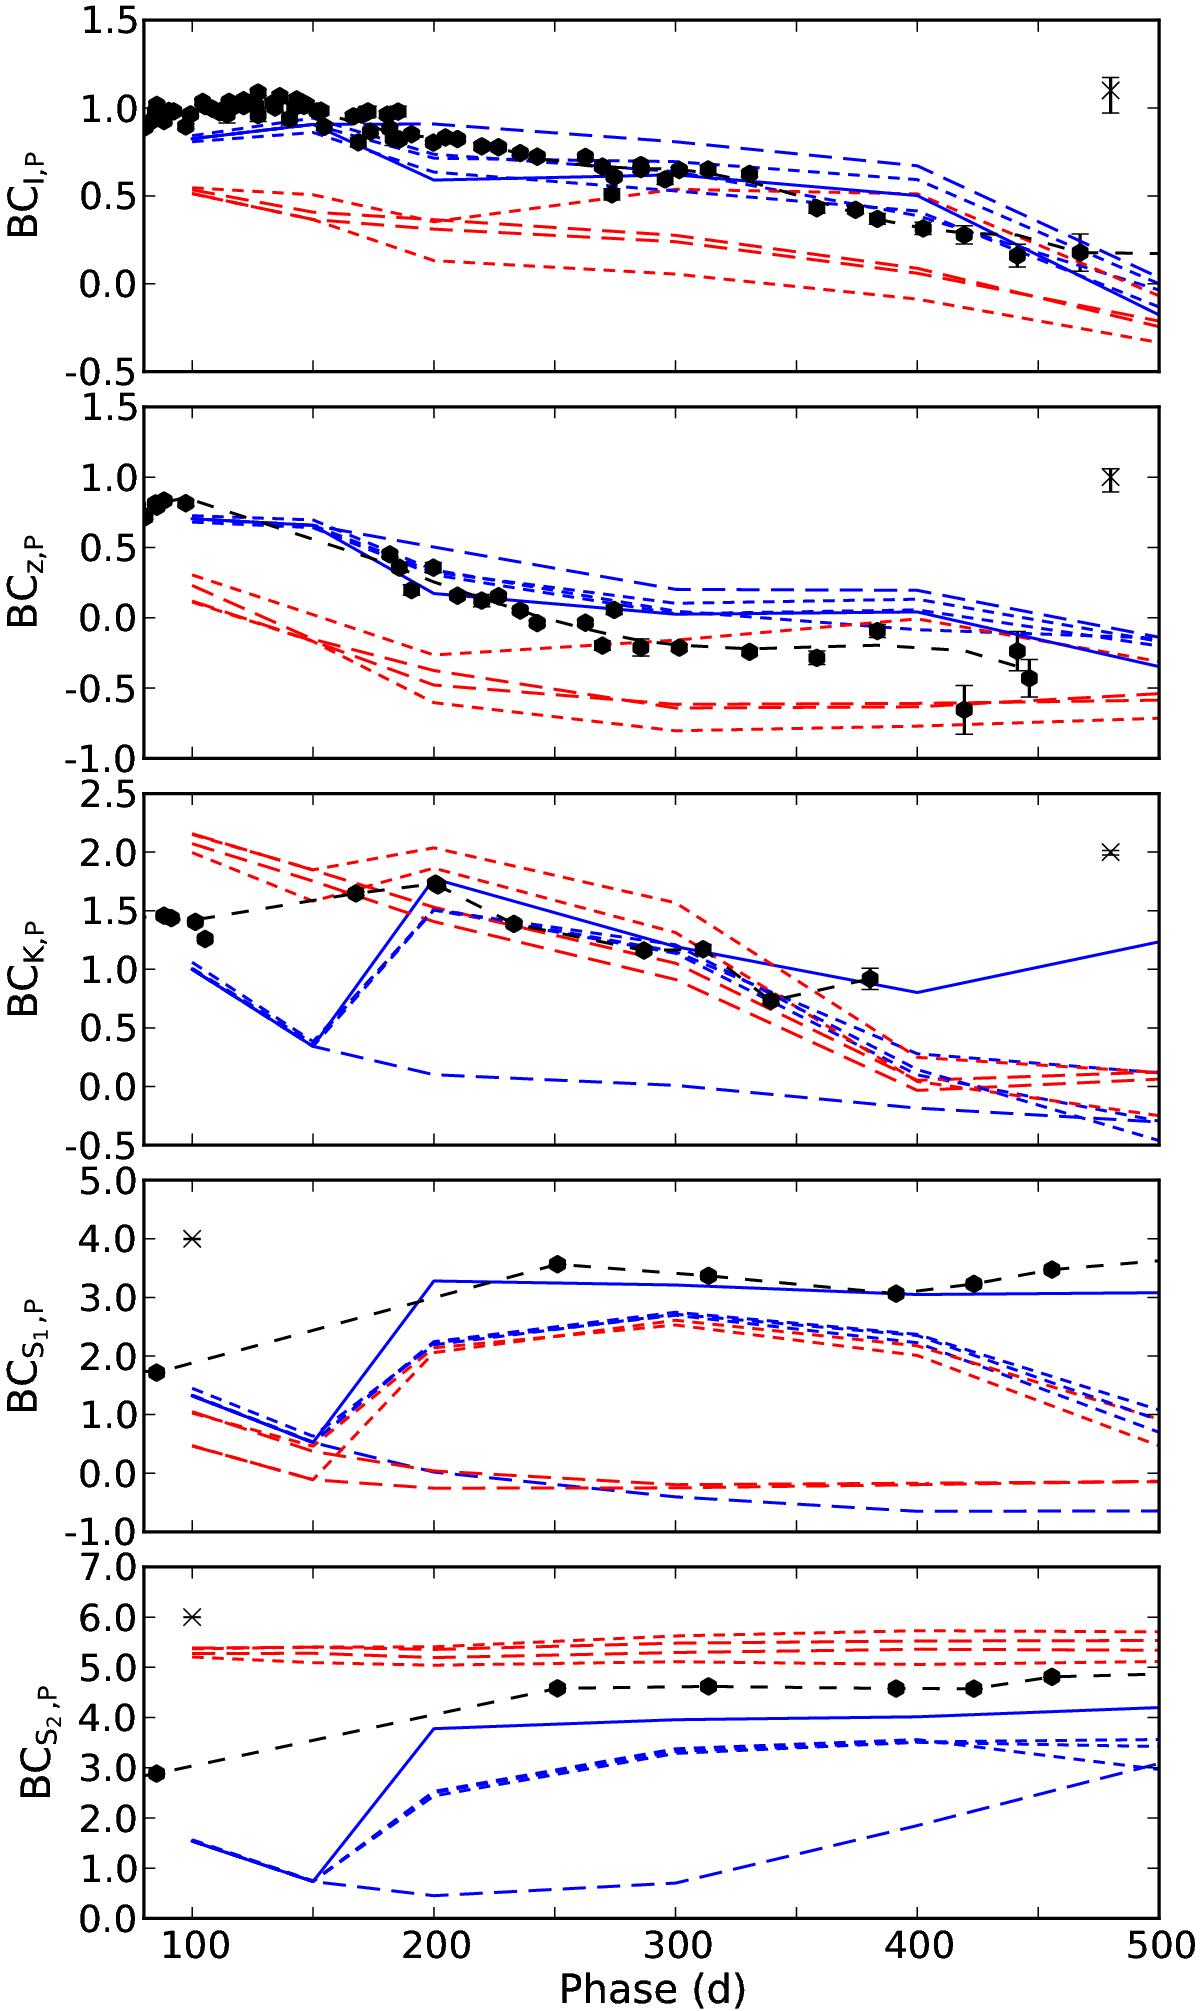
Observed (black circles) and J14 model pseudo-BCs between days 100 and 500 for the I, z, K, S1, and S2 bands. The model families differing in molecular cooling (complete, red; none, blue) and the optical depth of the dust (0, long-dashed; 0.25, short-dashed; 0.44, solid) are shown. 17 M⊙ and medium mixing models are not shown. The error bars arising from the extinction are marked in the upper left or right corner.
Current usage metrics show cumulative count of Article Views (full-text article views including HTML views, PDF and ePub downloads, according to the available data) and Abstracts Views on Vision4Press platform.
Data correspond to usage on the plateform after 2015. The current usage metrics is available 48-96 hours after online publication and is updated daily on week days.
Initial download of the metrics may take a while.