Fig. 14
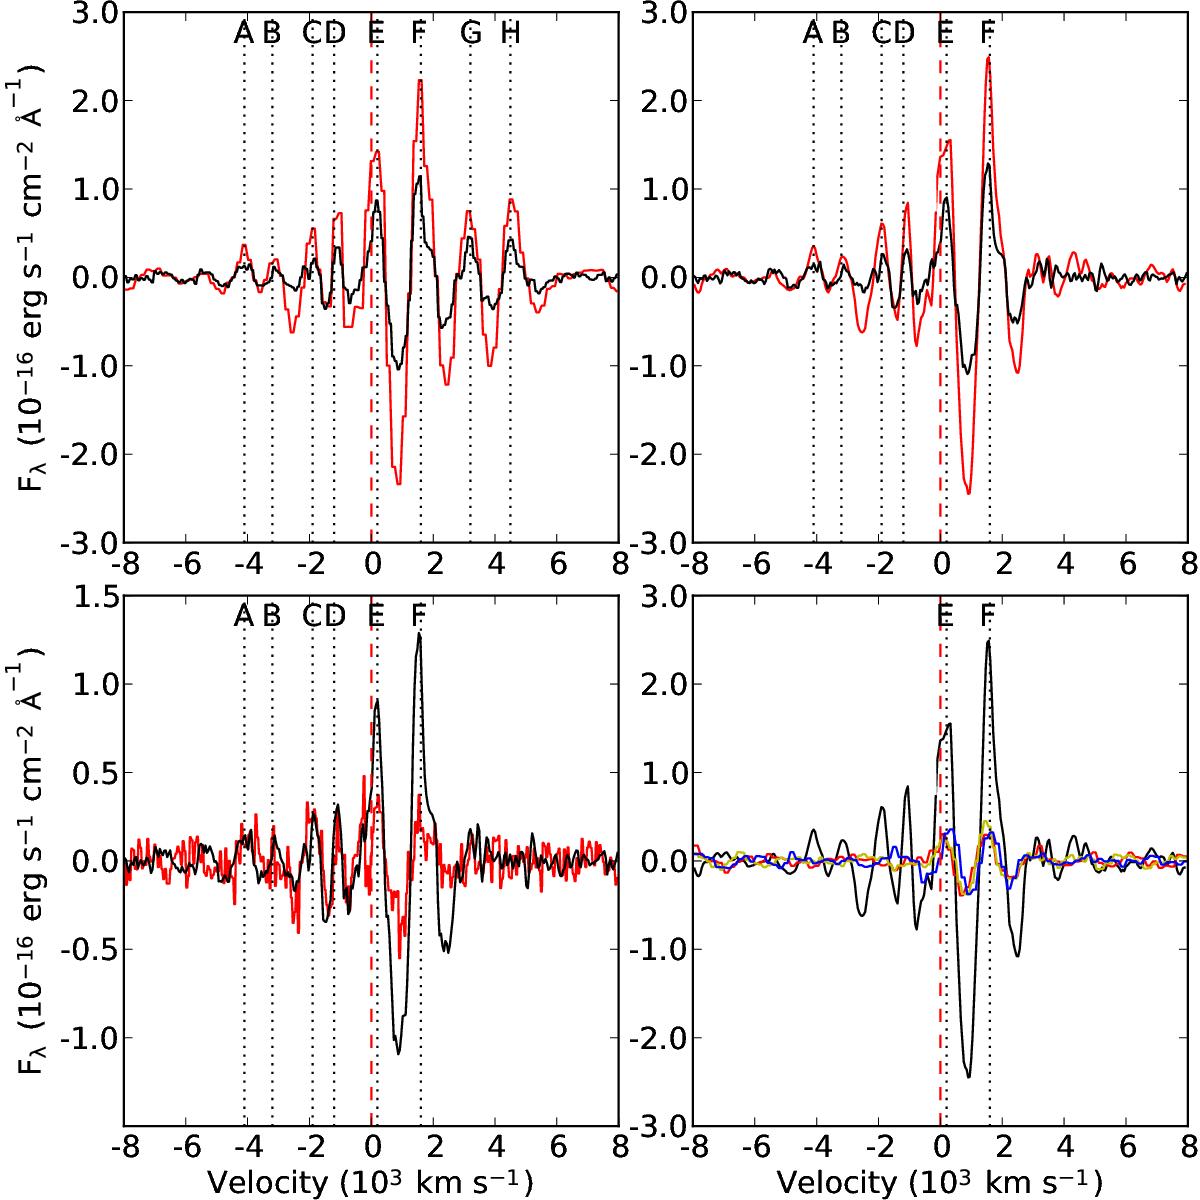
Comparison of large scale subtracted line profiles. The upper left panel shows the [O i] 6300, 6364 Å line at days 202 (red) and 300 (black). The upper right panel shows the decomposed [O i] 6300 Å line at days 202 (red) and 300 (black). The lower left panel shows the decomposed [O i] 6300 Å line (black) and the Mg i] 4571 Å line (red) at day 300. The lower right panel shows the decomposed [O i] 6300 Å line (black) and the [O i] 5577 Å (red), O i 7774 Å (green), and Na i 5890, 5896 Å (blue) lines at day 202.
Current usage metrics show cumulative count of Article Views (full-text article views including HTML views, PDF and ePub downloads, according to the available data) and Abstracts Views on Vision4Press platform.
Data correspond to usage on the plateform after 2015. The current usage metrics is available 48-96 hours after online publication and is updated daily on week days.
Initial download of the metrics may take a while.