Fig. 7
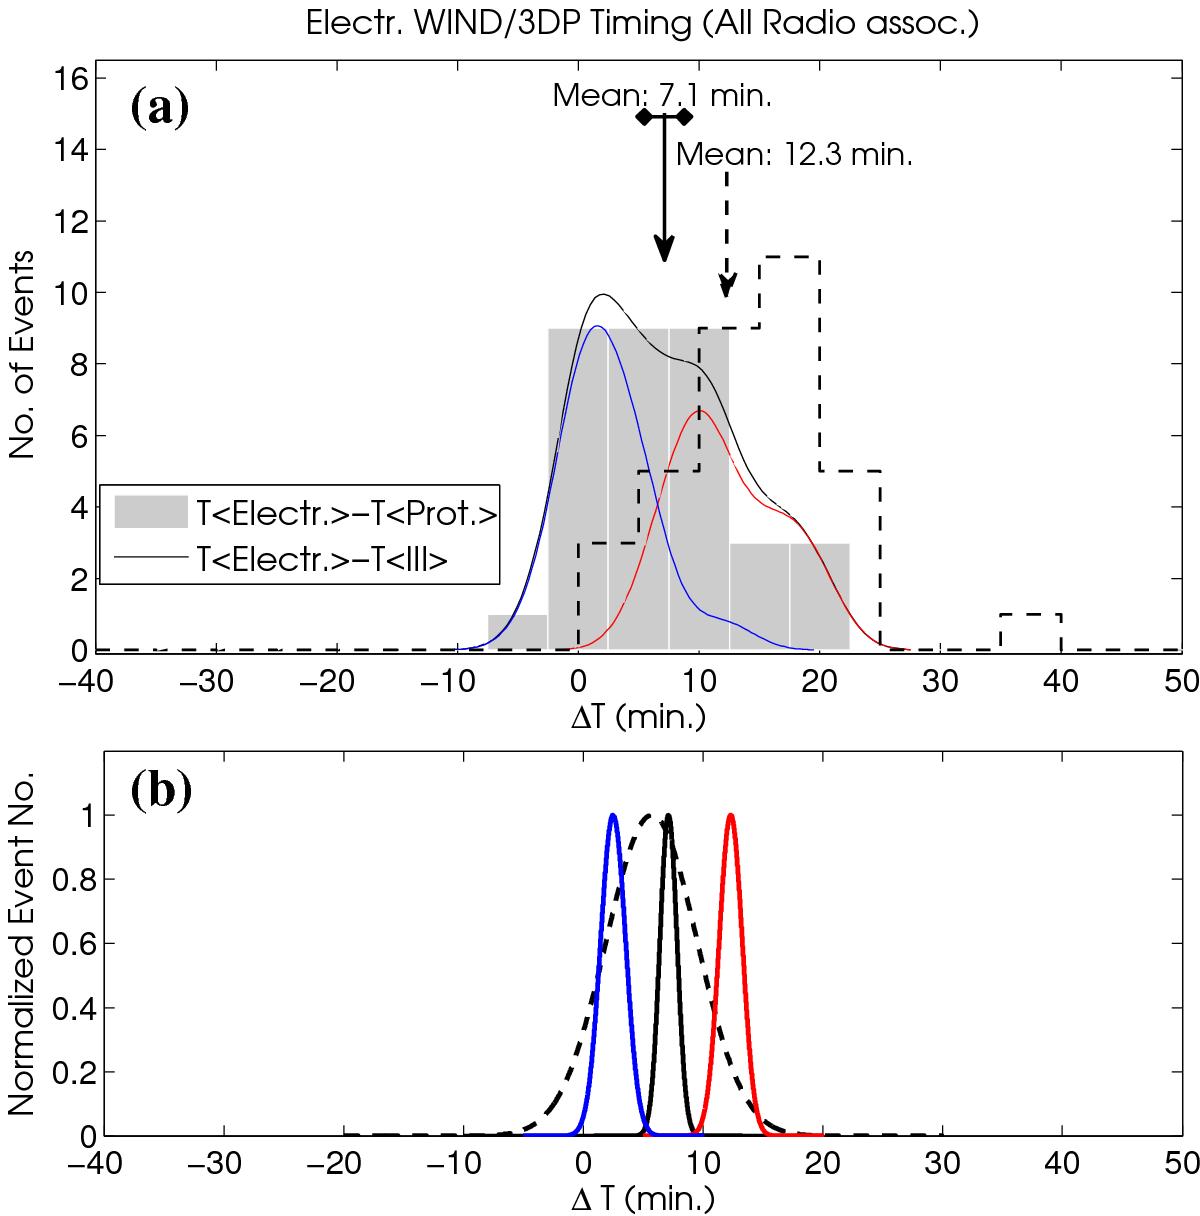
a) Grey histogram: distribution of the time difference between electron release derived from the VDA of Wind/3DP electron data and the proton release time, derived from the VDA of SOHO/ERNE proton data. Dashed histogram: distribution of the time difference between electron release derived from the VDA of Wind/3DP electron data and the type III start. With the solid line arrow and the dashed line arrow we mark the mean values of the electron-proton and the electron-type III timing difference, respectively. The solid lines show the distribution functions of the type III-proton release timings using all the events (black) and the separate cases of delayed (red) and simultaneous events (blue). b) Best-fit Gaussians of the electron-proton release timings mean and maximum values (black solid and dashed lines) derived from the Monte Carlo analysis using all the events. The red and blue solid lines show the best-fit Gaussians to the distributions for the mean values of the simultaneous and delayed cases, respectively.
Current usage metrics show cumulative count of Article Views (full-text article views including HTML views, PDF and ePub downloads, according to the available data) and Abstracts Views on Vision4Press platform.
Data correspond to usage on the plateform after 2015. The current usage metrics is available 48-96 hours after online publication and is updated daily on week days.
Initial download of the metrics may take a while.