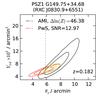
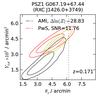
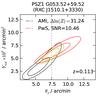
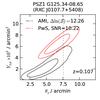
Fig. B.1
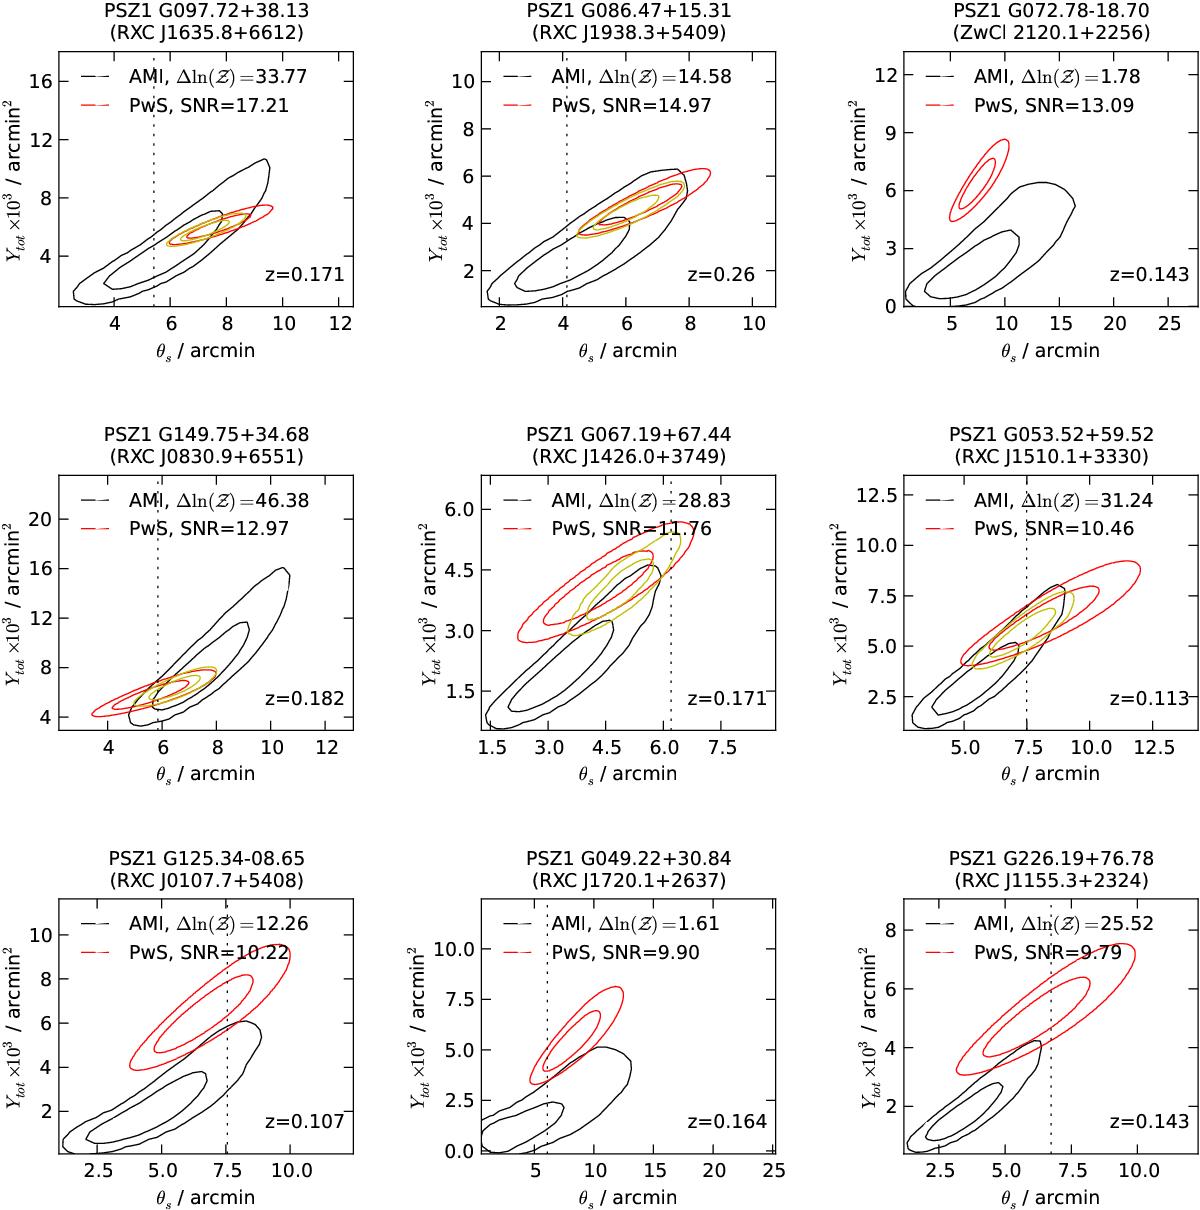
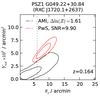
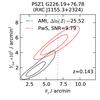
Ytot–θs posterior distributions for AMI and Planck, in descending Planck S/N order (note that this is the compatibility S/N for PwS), for all AMI detections (![]() ). Contours mark the 68% and 95% confidence limits of the posterior distributions. Where available, X-ray values for θs converted from θ500 values from Piffaretti et al. (2011) using the universal c500 = 1.177 are shown with black dotted lines.
). Contours mark the 68% and 95% confidence limits of the posterior distributions. Where available, X-ray values for θs converted from θ500 values from Piffaretti et al. (2011) using the universal c500 = 1.177 are shown with black dotted lines.
Current usage metrics show cumulative count of Article Views (full-text article views including HTML views, PDF and ePub downloads, according to the available data) and Abstracts Views on Vision4Press platform.
Data correspond to usage on the plateform after 2015. The current usage metrics is available 48-96 hours after online publication and is updated daily on week days.
Initial download of the metrics may take a while.