Free Access
Fig. 36
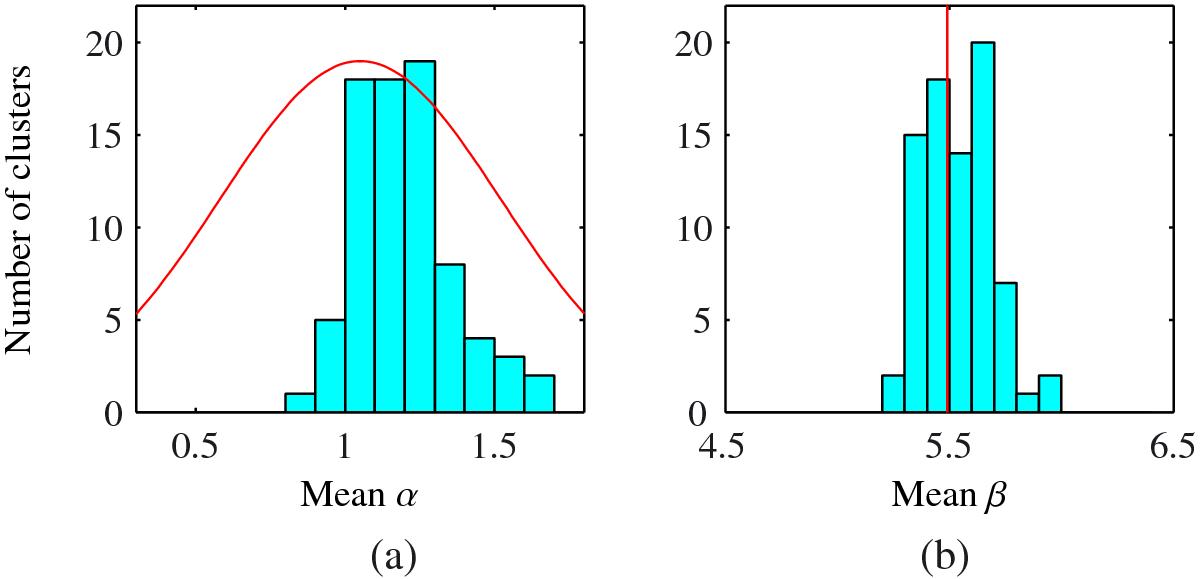
The distribution of mean values of α and β obtained for all the clear detections in the SZ sample. For comparison, the REXCESS-based prior on α (scaled arbitrarily) is also plotted in red, and the universal value of β predicted from numerical simulations is indicated with a red line.
Current usage metrics show cumulative count of Article Views (full-text article views including HTML views, PDF and ePub downloads, according to the available data) and Abstracts Views on Vision4Press platform.
Data correspond to usage on the plateform after 2015. The current usage metrics is available 48-96 hours after online publication and is updated daily on week days.
Initial download of the metrics may take a while.