Fig. 34
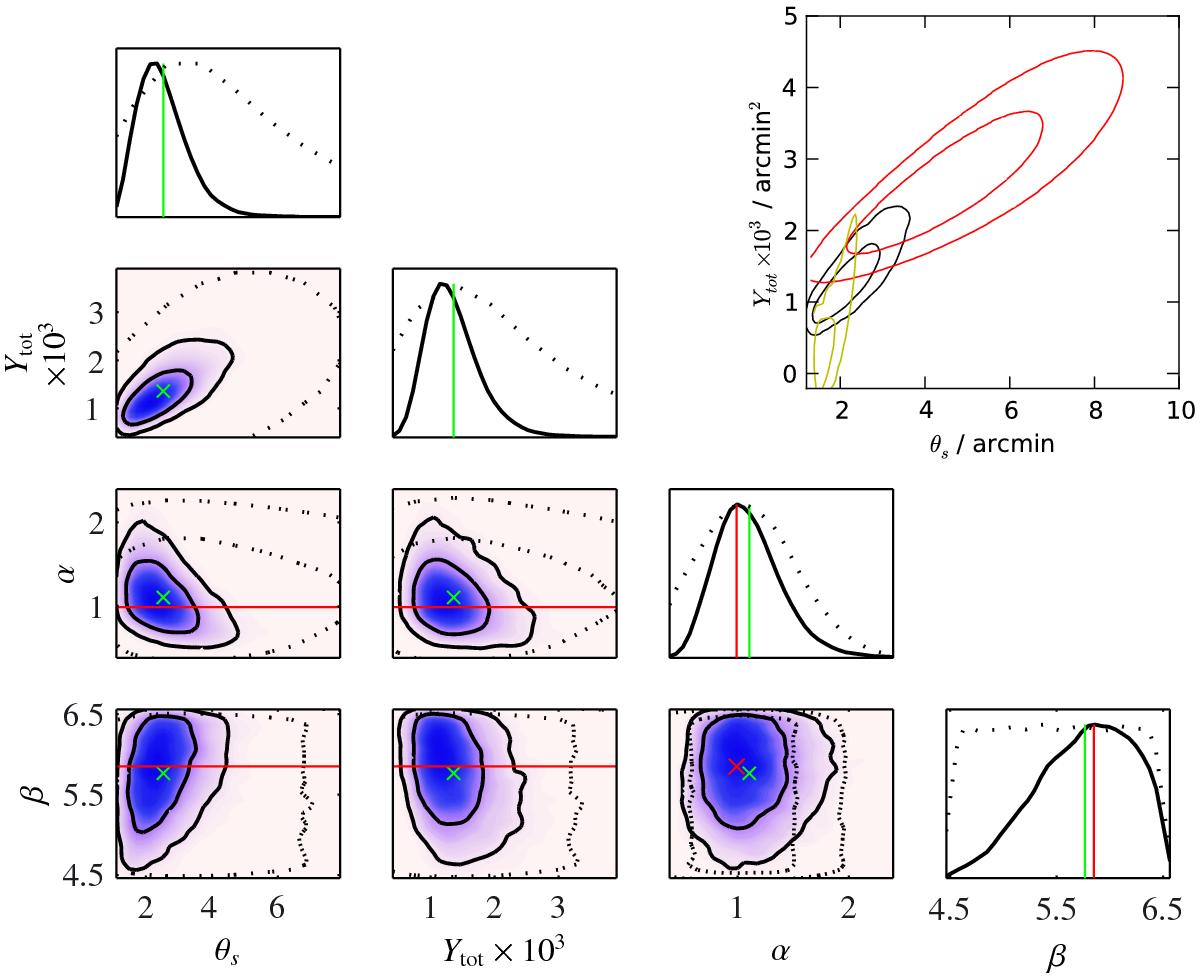
AMI posterior distributions for RXC J2228.6+2036, allowing α and β to vary. Posterior means are indicated with green lines and crosses, and the Planck values for α and β from Planck Collaboration Int. V (2013) are shown with red lines and crosses. The priors on the parameters in the AMI analysis are shown as black dashed lines. θs is in arcmin and Ytot is in arcmin2. Also shown in the upper right hand corner are the posteriors produced by AMI (black) and Planck (red) using the universal profile, and a prediction produced by the physical model described in Olamaie et al. (2012) based on a redshift of z = 0.412 (yellow).
Current usage metrics show cumulative count of Article Views (full-text article views including HTML views, PDF and ePub downloads, according to the available data) and Abstracts Views on Vision4Press platform.
Data correspond to usage on the plateform after 2015. The current usage metrics is available 48-96 hours after online publication and is updated daily on week days.
Initial download of the metrics may take a while.