Fig. 25
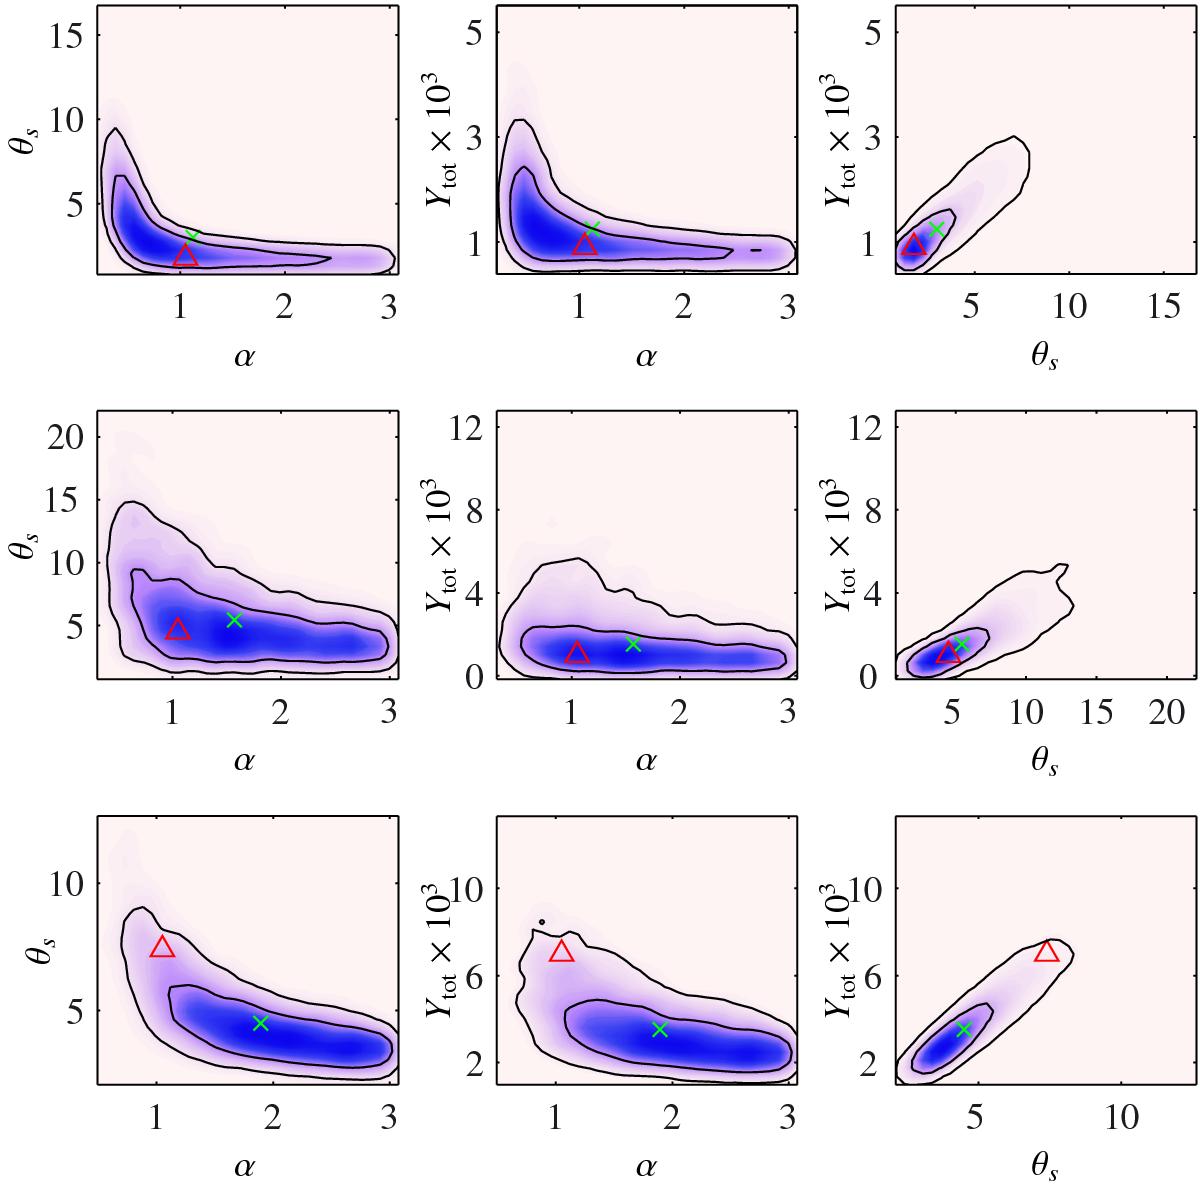
Posterior distributions for Ytot, θs and α for simulated low-noise data, for clusters with θs = 1.8 (top), 4.5 (centre) and 7.4 (bottom) arcmin and universal (γ,α,β), with the two-dimensional prior on Ytot and θs and a uniform prior on α between 0.1 and 3.0 (β fixed to the correct, input value). The input values are indicated by red triangles, and the posterior means with green crosses. θs is in arcmin and Ytot is in arcmin2.
Current usage metrics show cumulative count of Article Views (full-text article views including HTML views, PDF and ePub downloads, according to the available data) and Abstracts Views on Vision4Press platform.
Data correspond to usage on the plateform after 2015. The current usage metrics is available 48-96 hours after online publication and is updated daily on week days.
Initial download of the metrics may take a while.