Fig. 24
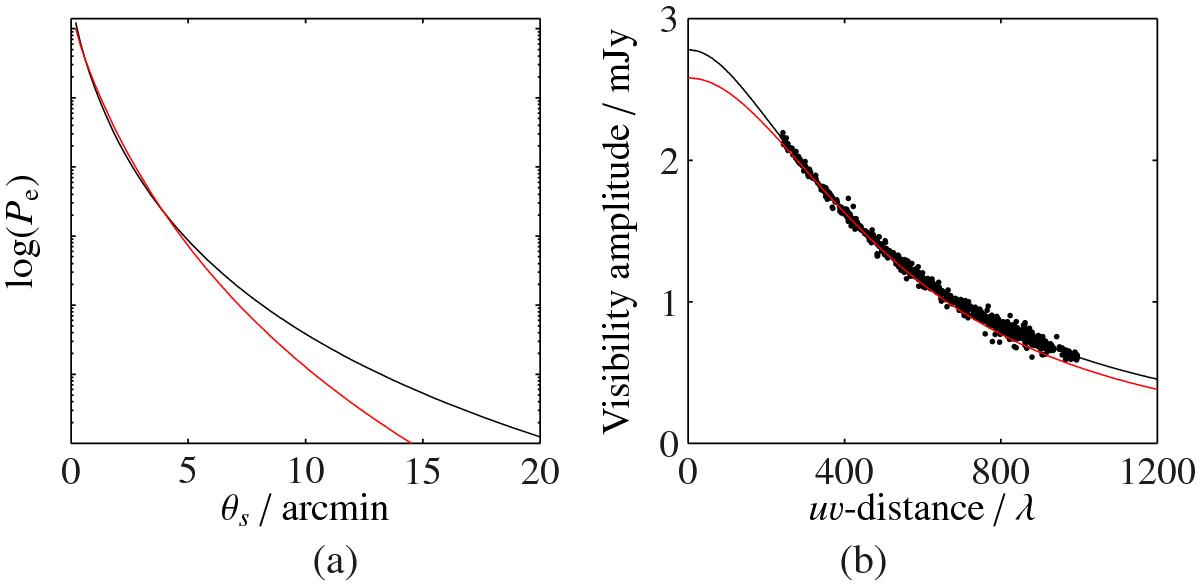
A profile generated with β = 5.4905,θs = 1.8 (the universal profile, black lines) can be mimicked for β = 8.9 using θs = 4.1 and adjusting Ytot downward (red lines). The two profiles are almost identical over the AMI-SA range of baselines, while Planck would measure the zero-spacing flux which differs by ≈7% between the two models. a) Shows the pressure profiles in radial coordinates (note that the y-axis scale is log); and b) shows the profiles in uv-space for channel 5, with the simulated AMI data shown as dots. Note that this simulation has been generated with an unrealistically small amount of thermal noise.
Current usage metrics show cumulative count of Article Views (full-text article views including HTML views, PDF and ePub downloads, according to the available data) and Abstracts Views on Vision4Press platform.
Data correspond to usage on the plateform after 2015. The current usage metrics is available 48-96 hours after online publication and is updated daily on week days.
Initial download of the metrics may take a while.