Fig. 2
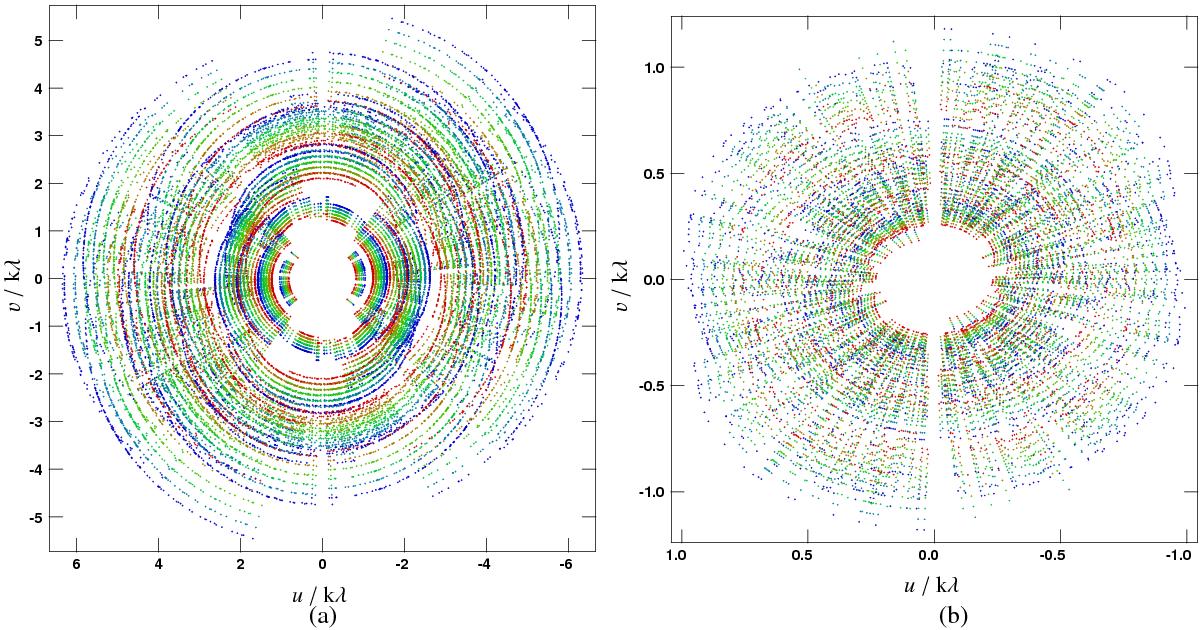
uv-coverages for a typical cluster observation at δ ≈ 54°, for the AMI-LA a) and SA b). The colours indicate different channels. Note the different axis scales; the short baselines of the SA are designed for sensitivity to arcminute-scale cluster emission, while the longer baselines of the LA are insensitive to emission on this scale and are used to characterise and subtract the foreground radio sources.
Current usage metrics show cumulative count of Article Views (full-text article views including HTML views, PDF and ePub downloads, according to the available data) and Abstracts Views on Vision4Press platform.
Data correspond to usage on the plateform after 2015. The current usage metrics is available 48-96 hours after online publication and is updated daily on week days.
Initial download of the metrics may take a while.