Fig. 19
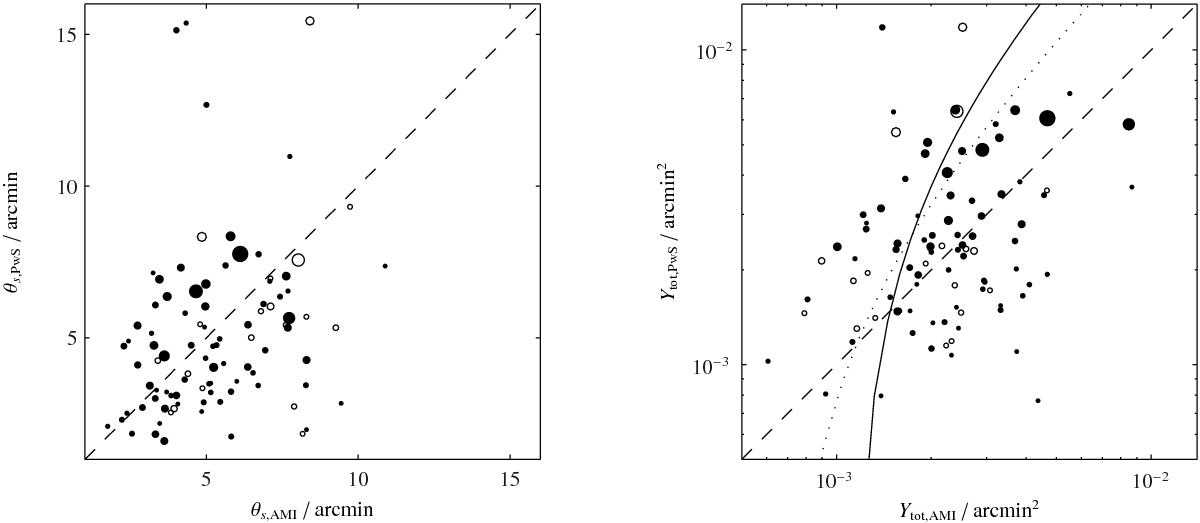
Comparison between PwS and AMI mean Ytot and θs values. The size of the points plotted increases with increasing Planck S/N; clear detections are plotted as filled circles, and moderate detections as empty circles. Error bars are omitted for clarity and since the errors in Ytot and θs are correlated. The one-to-one relationship is plotted as a black dashed line. The fitted linear relationship for all clusters (clear AMI detections only) with S/N greater than 7 is plotted as a black solid (black dotted) line.
Current usage metrics show cumulative count of Article Views (full-text article views including HTML views, PDF and ePub downloads, according to the available data) and Abstracts Views on Vision4Press platform.
Data correspond to usage on the plateform after 2015. The current usage metrics is available 48-96 hours after online publication and is updated daily on week days.
Initial download of the metrics may take a while.