Fig. 18
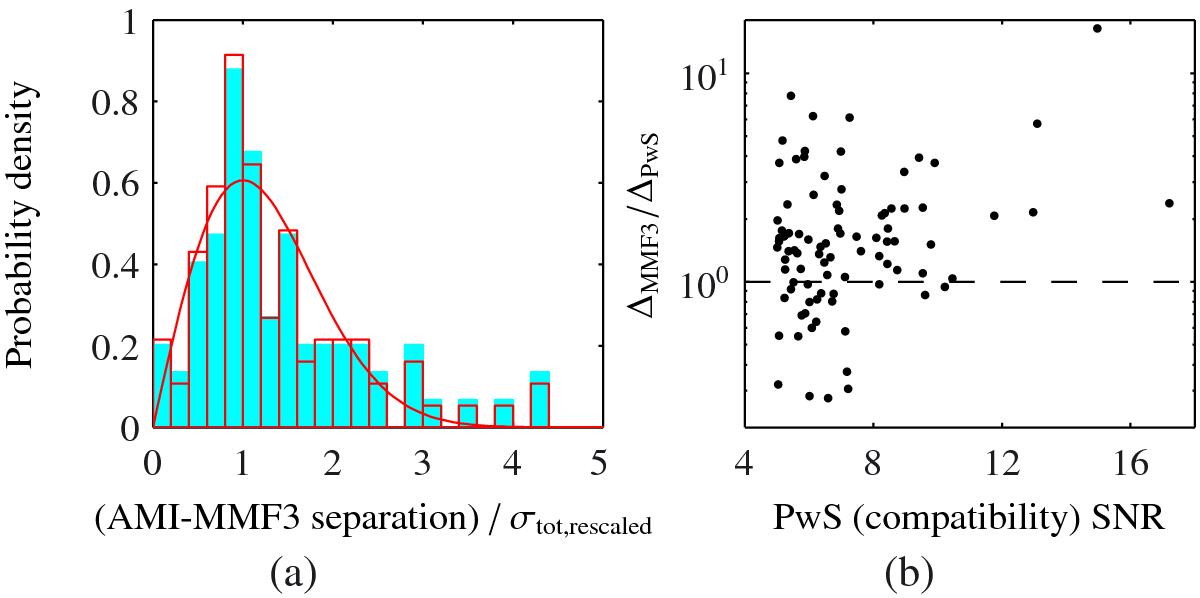
a) shows the MMF3 positional offset from AMI, normalised by rescaled total error ![]() . The solid histogram shows the clear detections only, and the red outline shows clear and moderate detections together. A Rayleigh distribution is plotted in red for comparison. b) shows the ratio between the absolute offsets (Δ) between AMI and MMF3 and AMI and PwS as a function of S/N; as shown in Fig. 16, PwS does better at high S/N.
. The solid histogram shows the clear detections only, and the red outline shows clear and moderate detections together. A Rayleigh distribution is plotted in red for comparison. b) shows the ratio between the absolute offsets (Δ) between AMI and MMF3 and AMI and PwS as a function of S/N; as shown in Fig. 16, PwS does better at high S/N.
Current usage metrics show cumulative count of Article Views (full-text article views including HTML views, PDF and ePub downloads, according to the available data) and Abstracts Views on Vision4Press platform.
Data correspond to usage on the plateform after 2015. The current usage metrics is available 48-96 hours after online publication and is updated daily on week days.
Initial download of the metrics may take a while.