Fig. 11
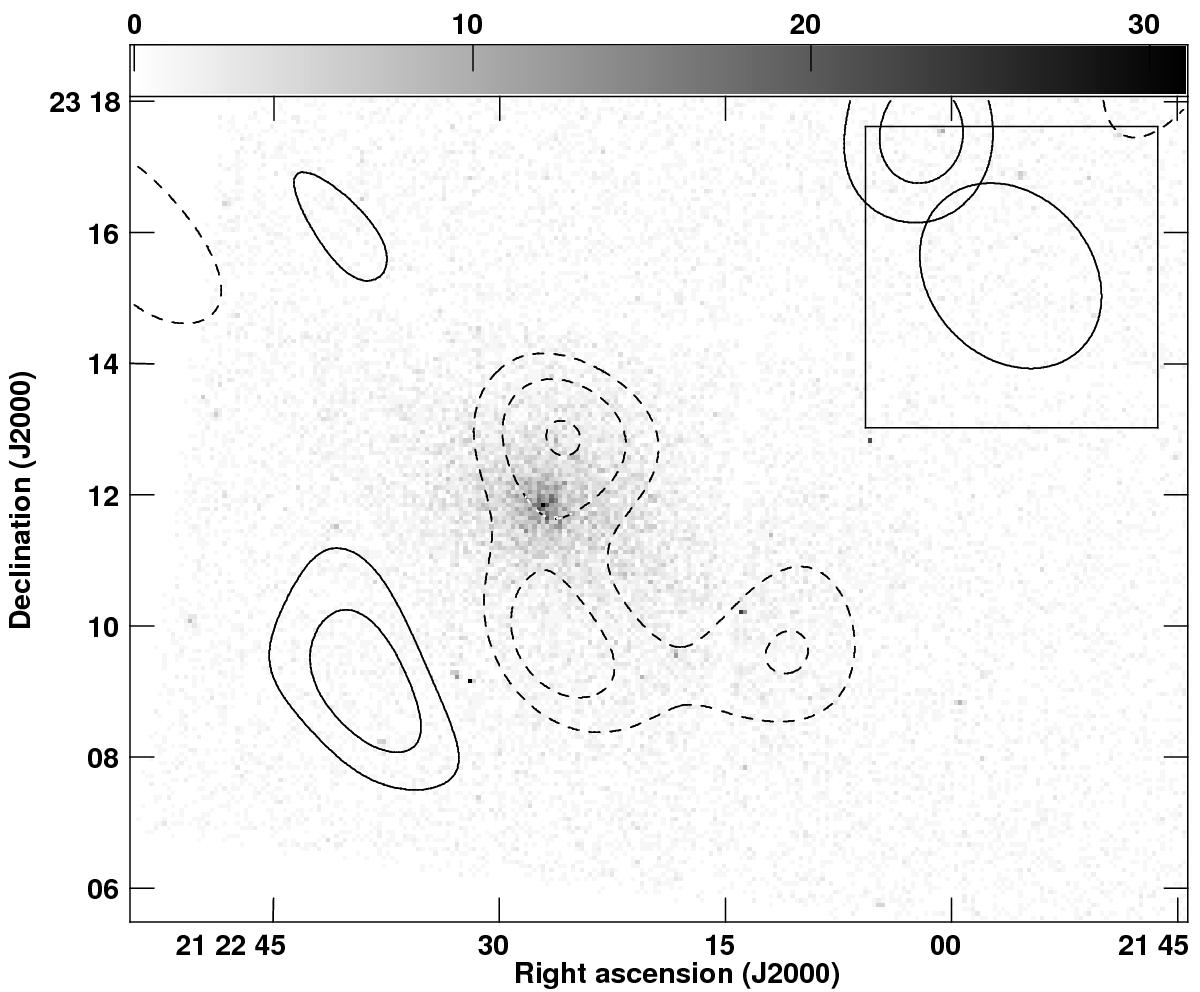
A Chandra X-ray map of ZW85034with AMI-SA contours at ± (2,3,4) × 100 μJy overlaid to show the substructure. The grey-scale is in units of counts per pixel and is truncated at the peak value in the centre of the cluster. The AMI synthesised beam is shown in the top right-hand corner. Note that the axis scale is different to Fig. 9.
Current usage metrics show cumulative count of Article Views (full-text article views including HTML views, PDF and ePub downloads, according to the available data) and Abstracts Views on Vision4Press platform.
Data correspond to usage on the plateform after 2015. The current usage metrics is available 48-96 hours after online publication and is updated daily on week days.
Initial download of the metrics may take a while.