Free Access
Fig. 1
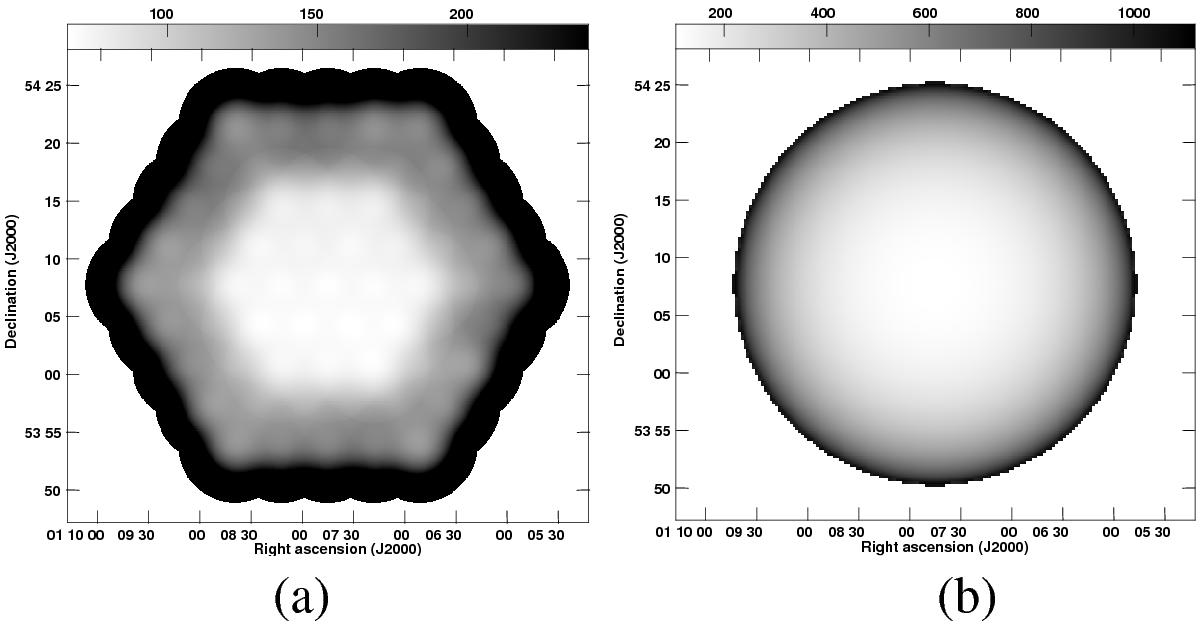
Noise maps for a typical cluster observation at δ ≈ 54° on the AMI-LA a) and SA b). The grey-scales are in μJy beam-1 and on a) the grey-scale is truncated to show the range of noise levels; b) is cut off at the 10% power point of the primary beam.
Current usage metrics show cumulative count of Article Views (full-text article views including HTML views, PDF and ePub downloads, according to the available data) and Abstracts Views on Vision4Press platform.
Data correspond to usage on the plateform after 2015. The current usage metrics is available 48-96 hours after online publication and is updated daily on week days.
Initial download of the metrics may take a while.