Fig. 5
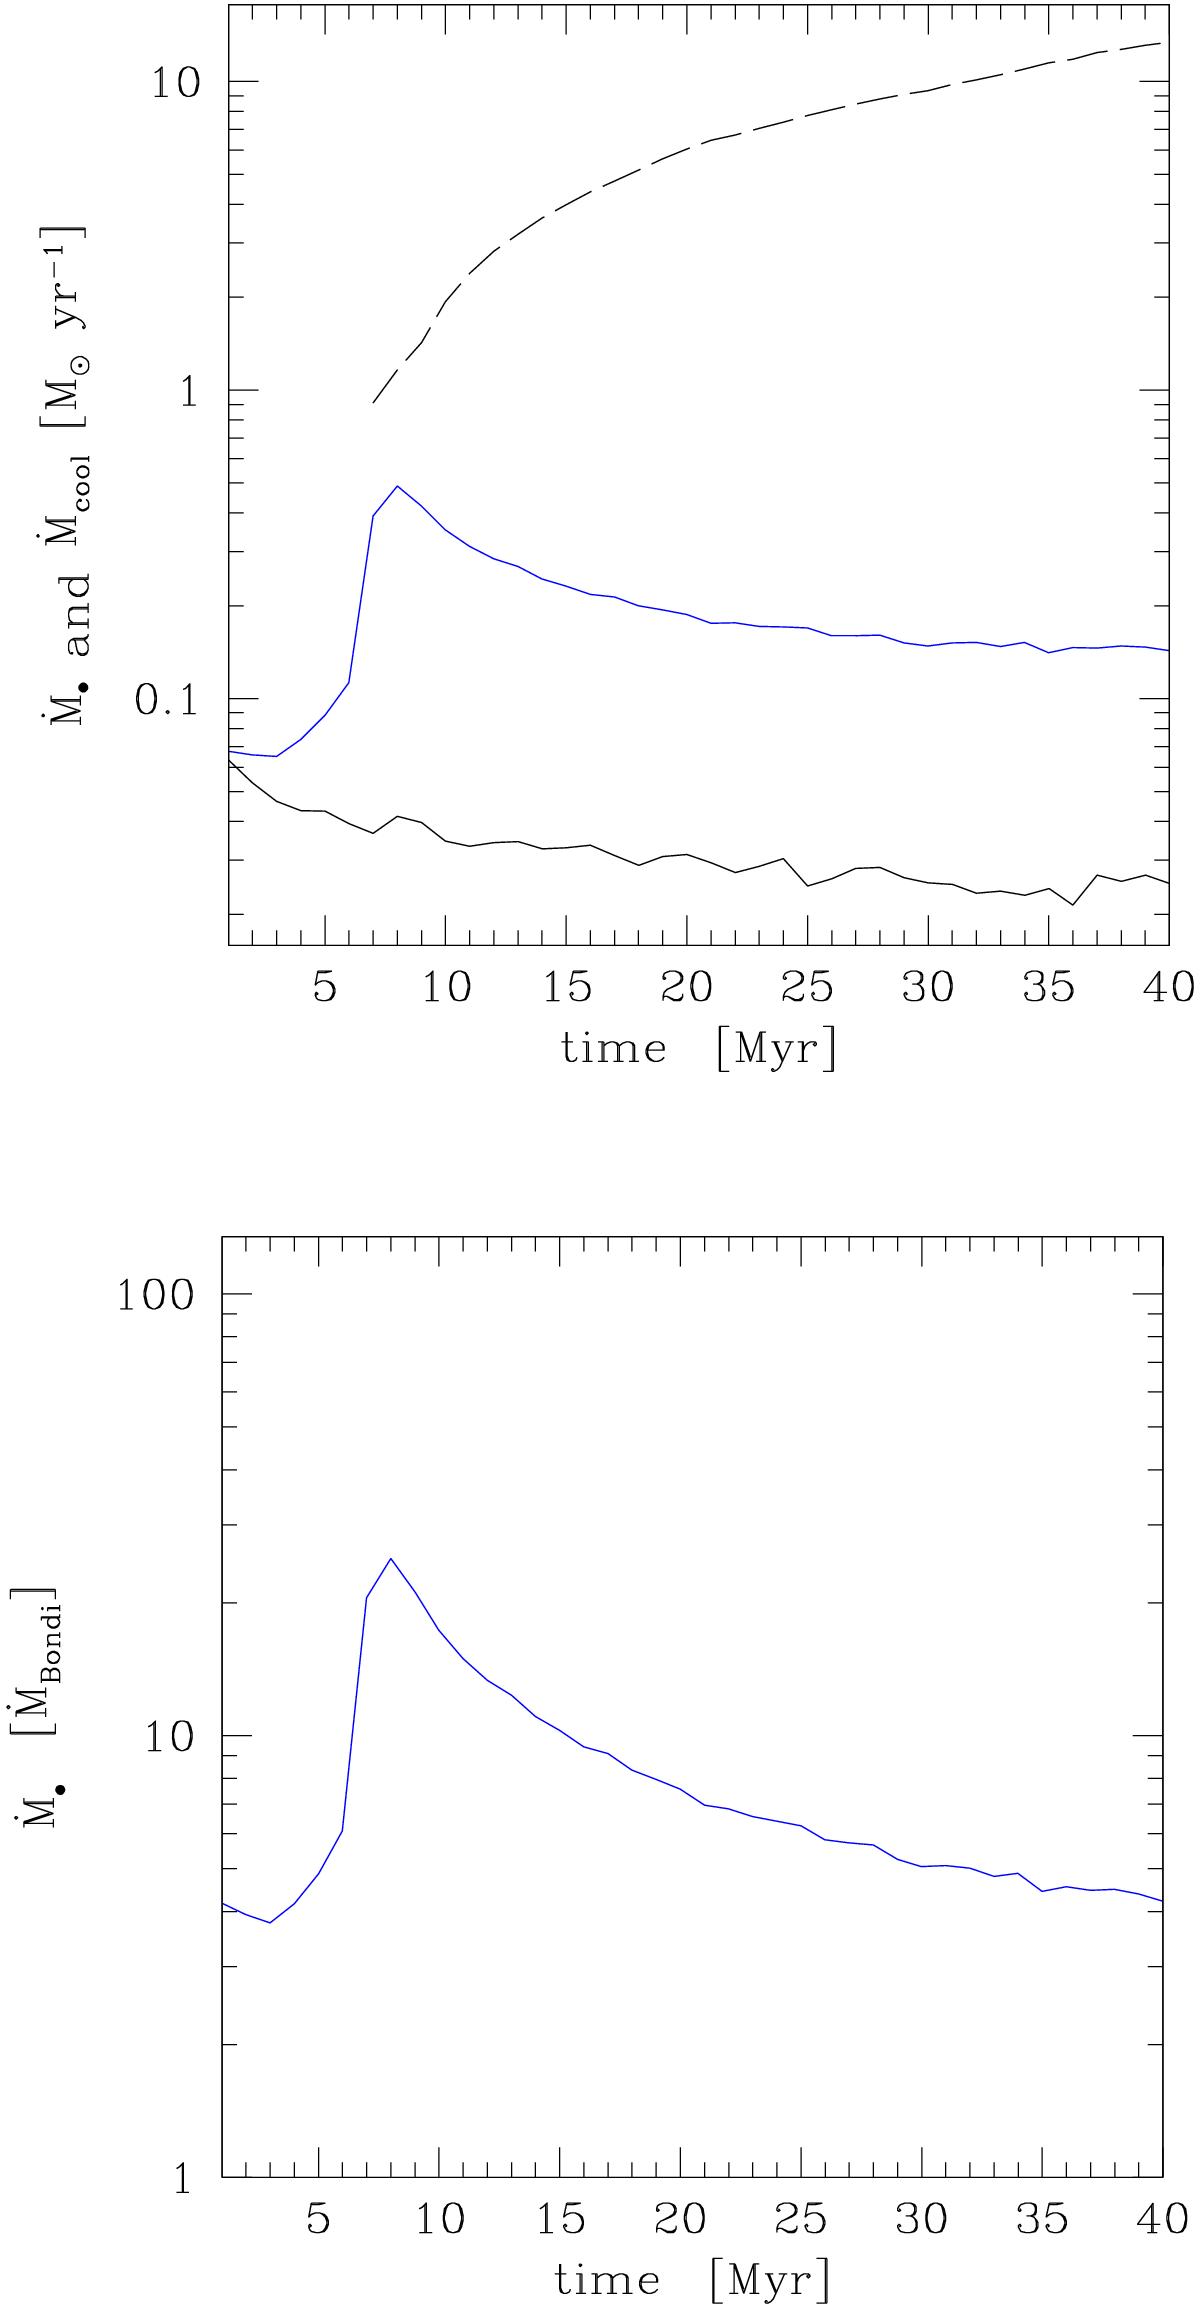
Accretion with cooling and erot = 0.3 (blue): evolution of the accretion rate (physical and normalized to the kpc-scale, runtime Bondi rate – top and bottom panel, respectively). The dashed line is the average cooling rate (related to the gas with T< 105 K). Solid black line is the adiabatic rotating model (Sect. 3). Despite the substantial cooling rates, yr-1, the final accretion rate is two orders of magnitude lower because of the formation of a rotationally-supported thin disk.
Current usage metrics show cumulative count of Article Views (full-text article views including HTML views, PDF and ePub downloads, according to the available data) and Abstracts Views on Vision4Press platform.
Data correspond to usage on the plateform after 2015. The current usage metrics is available 48-96 hours after online publication and is updated daily on week days.
Initial download of the metrics may take a while.