Fig. 17
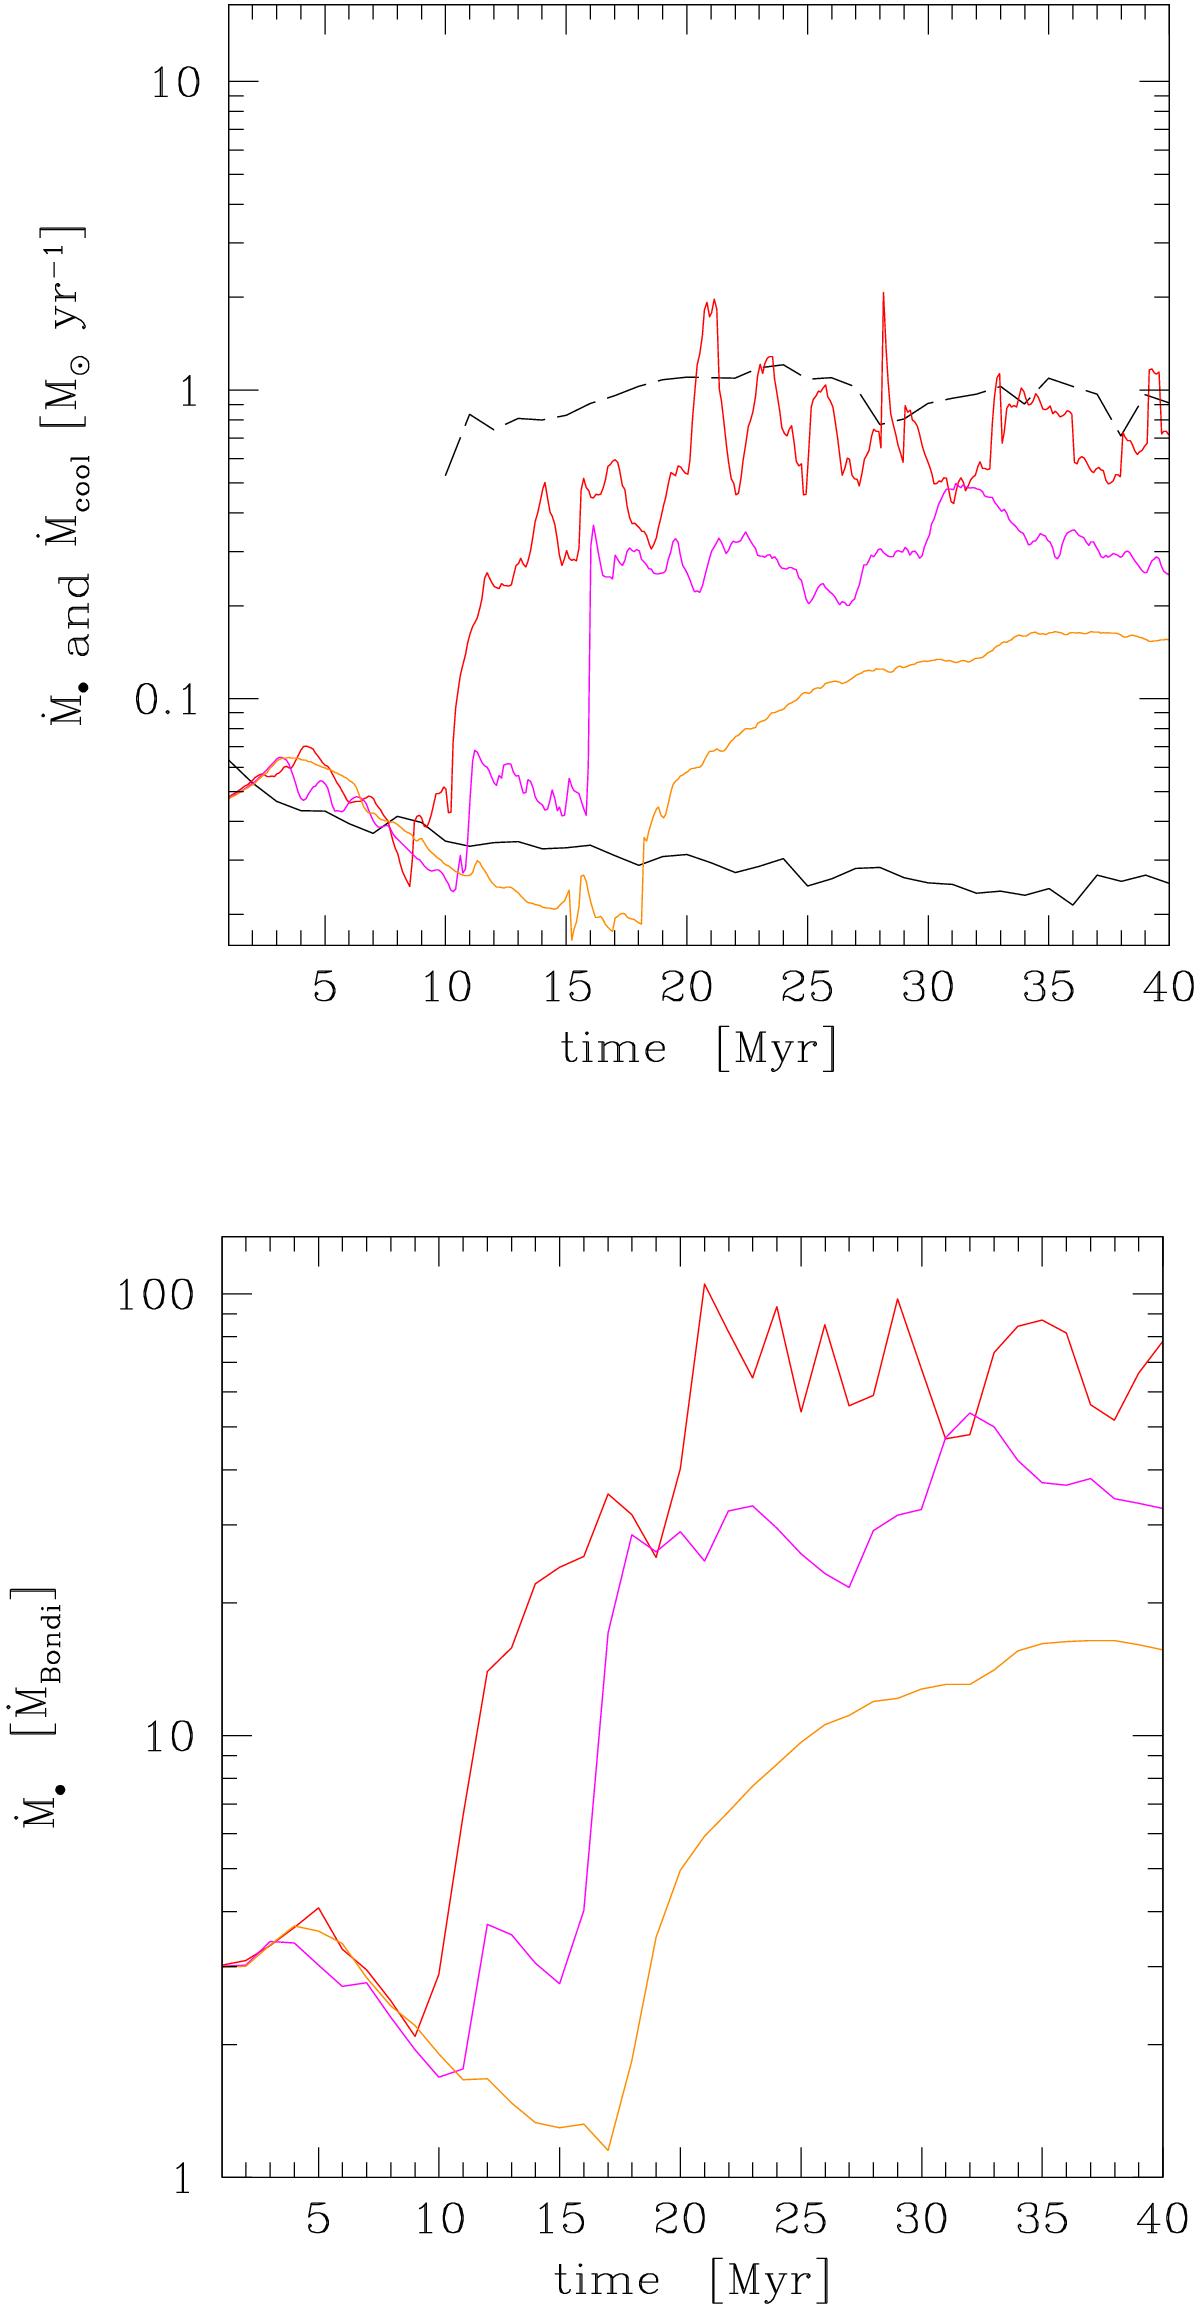
Accretion with heating, cooling, erot = 0.3, and varying levels of turbulence: evolution of the accretion rate (the Ṁ• average in the top panel has 0.1 Myr step). The Mach number varies from the reference Ma ~ 0.35 (red) to 1/2 (magenta) and 1/4 (orange) of this value, i.e., Tat ≃ 0.7,1.5,3, respectively. The dashed line is the average net cooling rate (1 Myr step). As before, the solid black line is the adiabatic rotating model, and the runtime Bondi rate for the normalized plot is computed at r ≈ 1–2 kpc (Sect. 3). In the atmosphere with Tat< 1, CCA drives the dynamics, boosting the accretion rate up to 100 × the Bondi rate, which is consistent with the nonrotating CCA evolution shown in G13. As Tat > 1, the accretion flow shifts from turbulence-driven (linked to extended filaments and boosted accretion) to rotationally-driven (tied to a coherent disk and suppressed accretion).
Current usage metrics show cumulative count of Article Views (full-text article views including HTML views, PDF and ePub downloads, according to the available data) and Abstracts Views on Vision4Press platform.
Data correspond to usage on the plateform after 2015. The current usage metrics is available 48-96 hours after online publication and is updated daily on week days.
Initial download of the metrics may take a while.