Free Access
Fig. 4
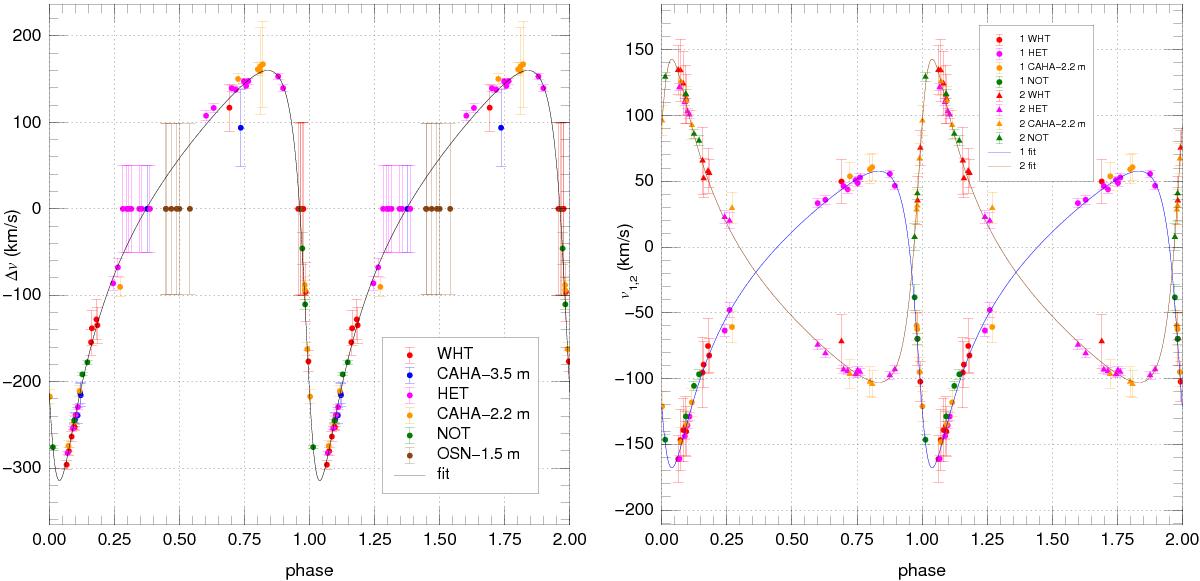
Phased radial velocity curves for Δv (left) and v1 + v2 (right). The color code identifies the telescope. The left plot includes all data points, while the right plot excludes the two telescopes without accurate absolute velocity calibration (CAHA-3.5 m and OSN-1.5 m).
This figure is made of several images, please see below:
Current usage metrics show cumulative count of Article Views (full-text article views including HTML views, PDF and ePub downloads, according to the available data) and Abstracts Views on Vision4Press platform.
Data correspond to usage on the plateform after 2015. The current usage metrics is available 48-96 hours after online publication and is updated daily on week days.
Initial download of the metrics may take a while.