Fig. 4
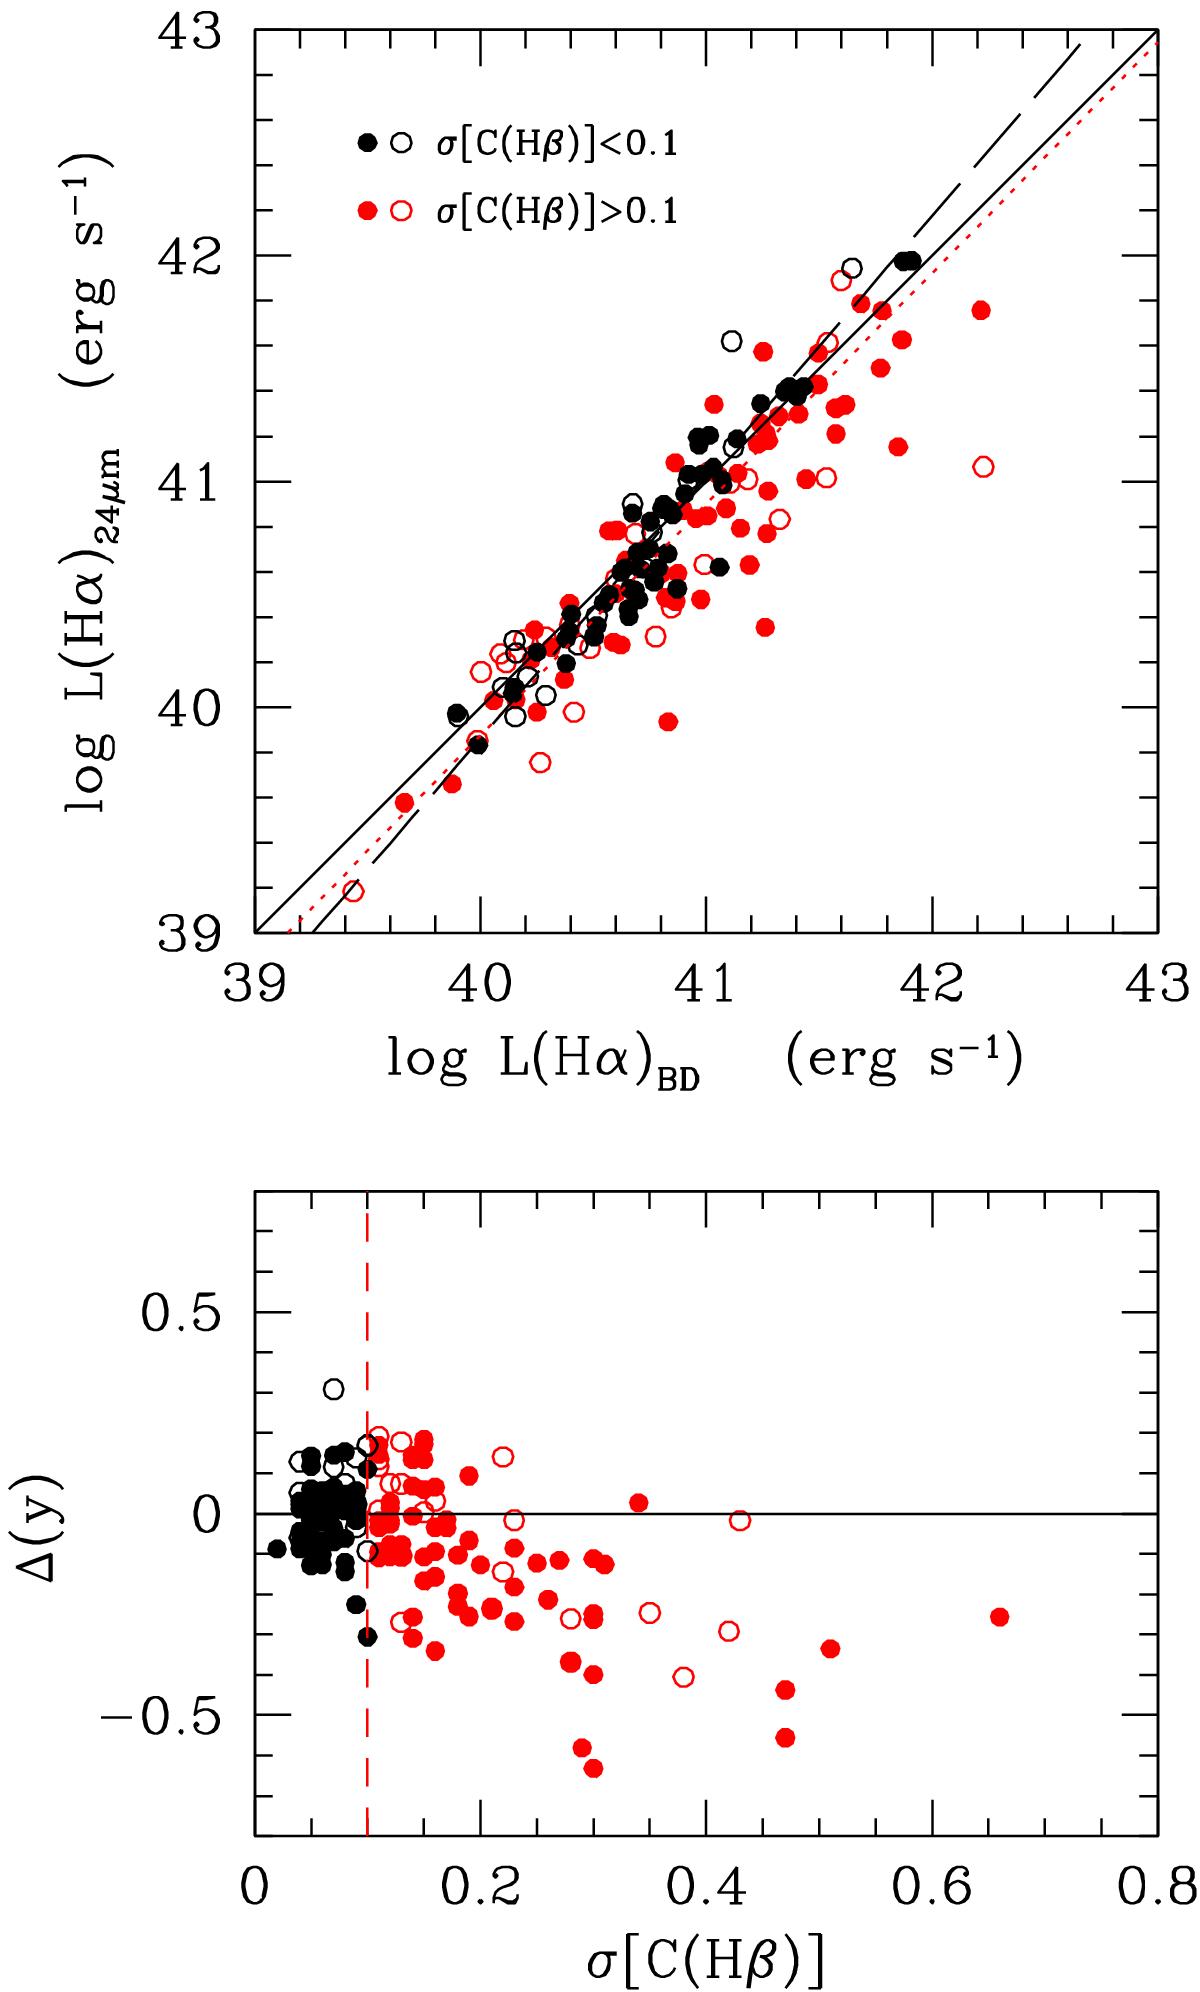
Upper panel: relationship between the Hα luminosity corrected for dust attenuation using the 24 μm luminosity and the prescription of Calzetti et al. (2010) and the Hα luminosity corrected using the Balmer decrement. Black symbols are for galaxies with a σ [C(Hβ)] ≤ 0.1, and red symbols for σ [C(Hβ)] > 0.1. Filled dots are for galaxies with normal gas content (HI-def ≤ 0.4), and empty symbols for gas-poor objects (HI-def > 0.4). The black solid line shows the 1:1 relation, the black long-dashed line the bisector fit (Isobe et al. 1990) determined using the best quality sample (σ [C(Hβ)] ≤ 0.1), while the red dotted line shows the best fit determined using the whole sample. Lower panel: relationship between the distance from the L(Hα)24μ vs. L(Hα)BD relation and the uncertainty on the Balmer decrement estimate σ [C(Hβ)]. The vertical red dashed line shows the limit in σ [C(Hβ)] = 0.1 above which the data are asymmetrically distributed in Δ(y).
Current usage metrics show cumulative count of Article Views (full-text article views including HTML views, PDF and ePub downloads, according to the available data) and Abstracts Views on Vision4Press platform.
Data correspond to usage on the plateform after 2015. The current usage metrics is available 48-96 hours after online publication and is updated daily on week days.
Initial download of the metrics may take a while.