Fig. 14
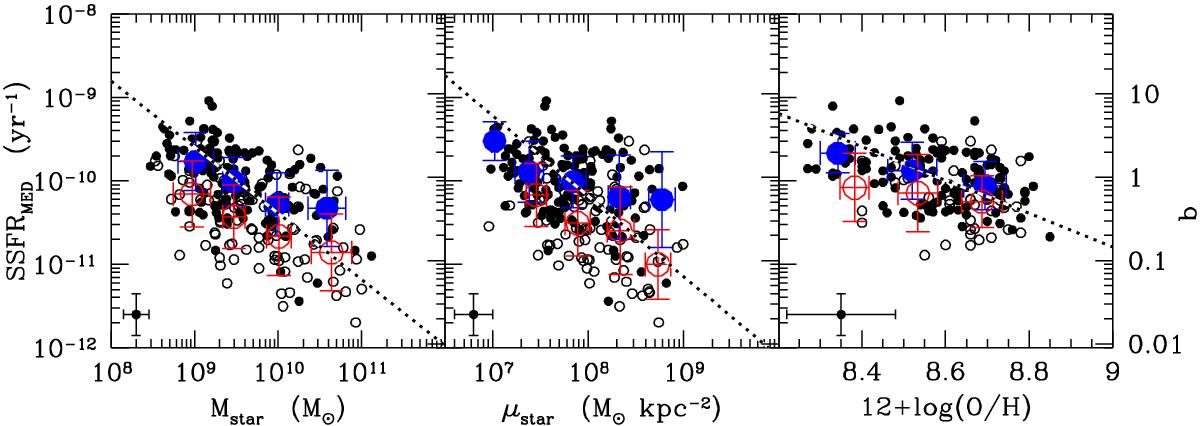
Relationship between the specific star formation rate and the total stellar mass (left), the stellar mass surface density (centre), and the metallicity (right) for HI-normal (HI - def ≤ 0.4; filled dots) and HI-deficient (HI - def > 0.4; empty circles) galaxies. The large filled blue dots indicate the mean values for each morphological class for normal gas-rich systems and the empty red ones for cluster HI-deficient galaxies. For the large symbols the error bar shows the standard deviation of the distribution. The dotted line shows the bisector fit determined for HI-normal galaxies. The small error bar shows the typical uncertainty on the data.
Current usage metrics show cumulative count of Article Views (full-text article views including HTML views, PDF and ePub downloads, according to the available data) and Abstracts Views on Vision4Press platform.
Data correspond to usage on the plateform after 2015. The current usage metrics is available 48-96 hours after online publication and is updated daily on week days.
Initial download of the metrics may take a while.