Fig. 9
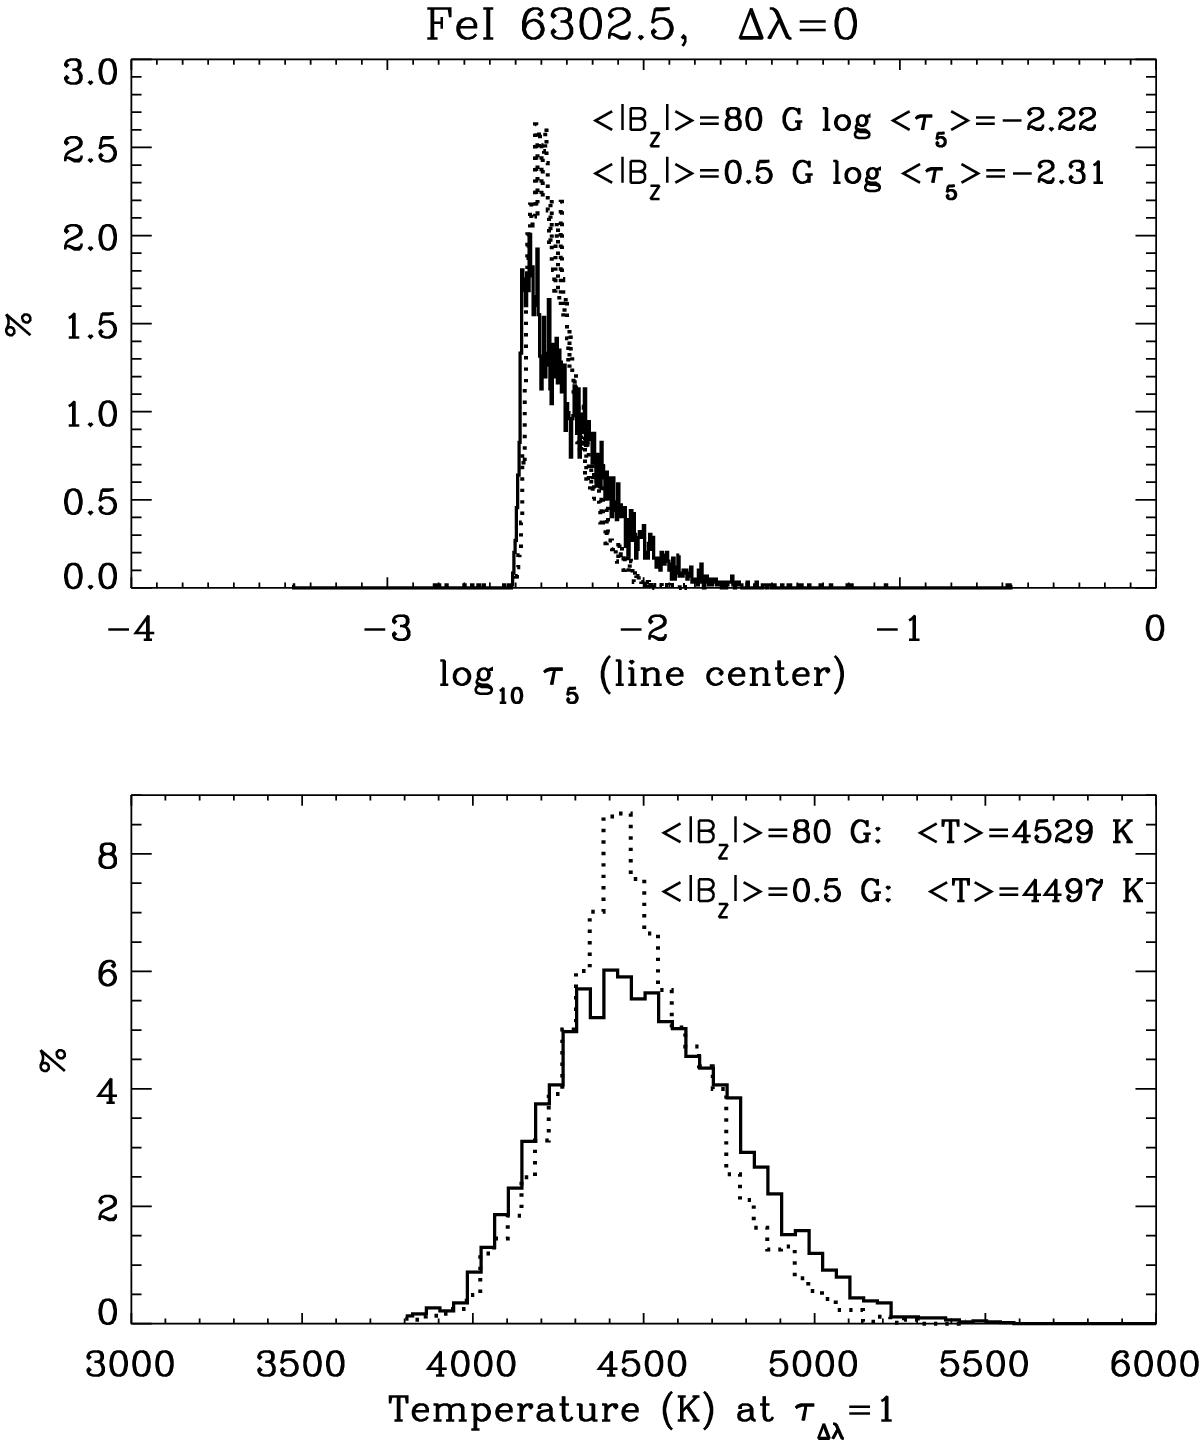
Histograms of the logarithmic optical depths log10τ5(line center) (top panel) and of the temperatures (bottom panel) at the photospheric layers where the line center of the Fe i 6302.50 Å is formed. Solid and dotted curves show results, respectively, for the 3D model snapshots with ⟨ | Bz | ⟩ = 80 G and ⟨ | Bz | ⟩ = 0.5 G. The mean values of the temperature and optical depth are shown, respectively, in the upper right and upper left corners of the corresponding panels.
Current usage metrics show cumulative count of Article Views (full-text article views including HTML views, PDF and ePub downloads, according to the available data) and Abstracts Views on Vision4Press platform.
Data correspond to usage on the plateform after 2015. The current usage metrics is available 48-96 hours after online publication and is updated daily on week days.
Initial download of the metrics may take a while.