Fig. 8
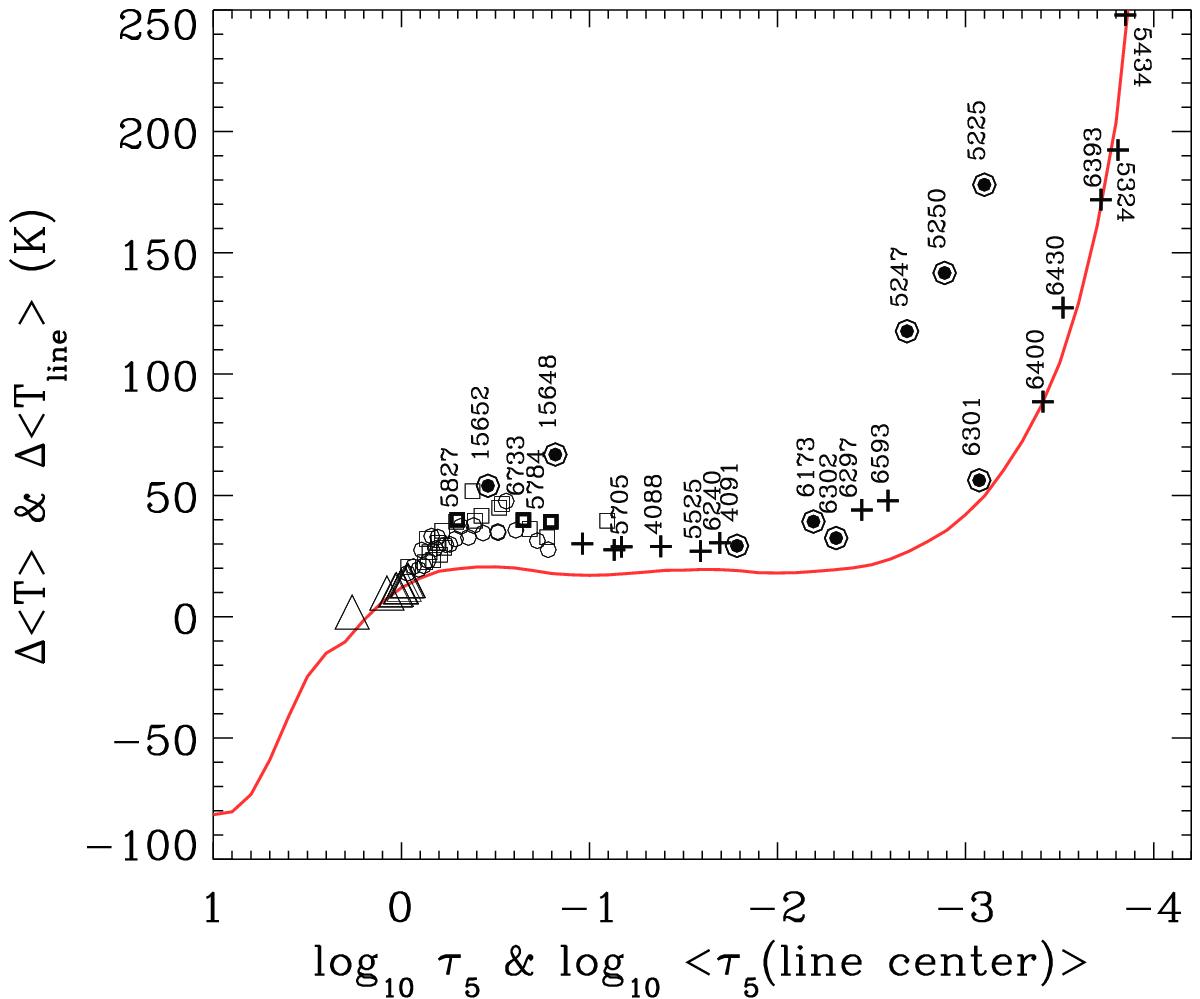
Δ ⟨ T ⟩ changes of the temperature stratifications of the ⟨ | Bz | ⟩ = 80 G and ⟨ | Bz | ⟩ = 0.5 G snapshots versus the optical depth τ5 (solid red line). The Δ ⟨ T ⟩ values have been obtained after averaging the temperature over surfaces of equal optical depth τ5. The symbols indicate the differences between the mean temperatures Δ ⟨ Tline ⟩ in the formation layers of the Fe i line centers derived for the same snapshots; they are given against the mean line center optical depths ⟨ τ5(line center) ⟩ calculated in the ⟨ | Bz | ⟩ = 0.5 G snapshot. Circles, squares, crosses, and filled circles denote the same sets of lines as in Fig. 4. The symbols with triangles indicate the mean optical depths where the Fe i line wings originate.
Current usage metrics show cumulative count of Article Views (full-text article views including HTML views, PDF and ePub downloads, according to the available data) and Abstracts Views on Vision4Press platform.
Data correspond to usage on the plateform after 2015. The current usage metrics is available 48-96 hours after online publication and is updated daily on week days.
Initial download of the metrics may take a while.