Fig. 3
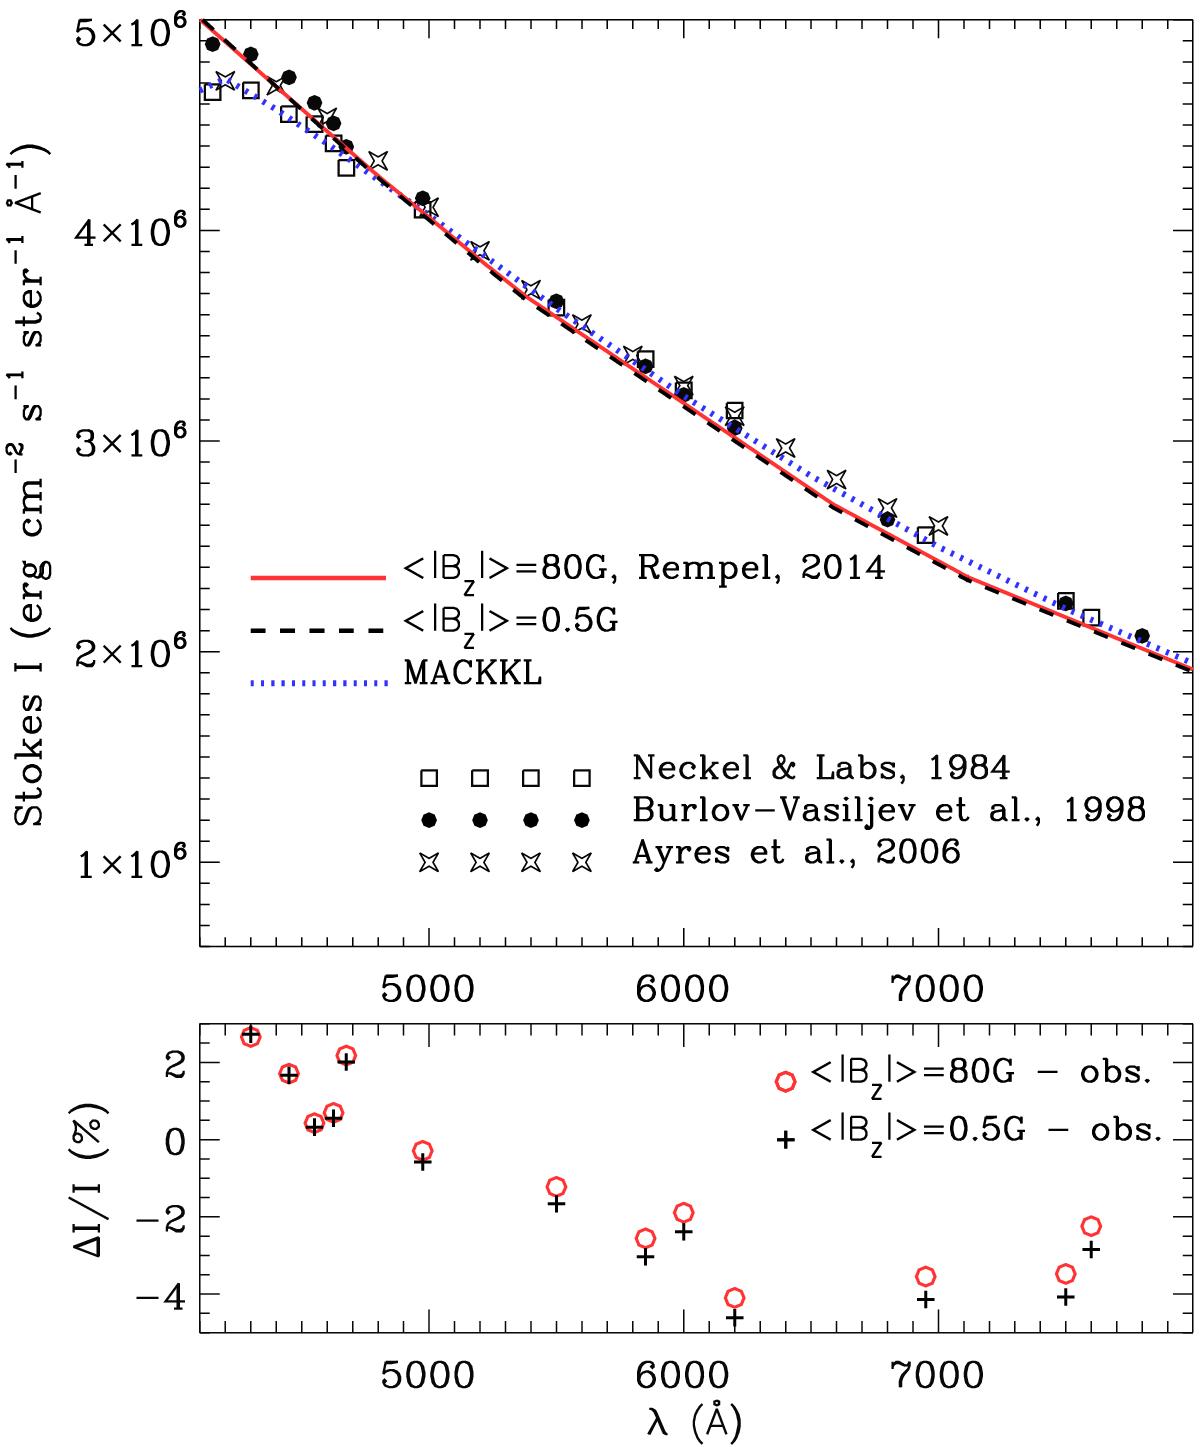
Top panel: wavelength variation of calculated and observed absolute continuum intensities at the solar disk center. The solid red and black dashed curves correspond, respectively, to the ⟨ | Bz | ⟩ = 80 G and ⟨ | Bz | ⟩ = 0.5 G 3D snapshot models of Rempel (2014). The dotted blue line refers to the 1D MACKKL quiet-Sun model (Maltby et al. 1986). The symbols indicate the observational data from Neckel & Labs (1984; squares), Burlov-Vasiljev et al. (1998; black circles), and Ayres et al. (2006; stars). Bottom panel: relative differences between continuum intensities calculated using the 3D snapshot model of Rempel (2014) and observational data taken from Neckel & Labs (1984). Red circles with crosses and black crosses represent, respectively, the results obtained with the ⟨ | Bz | ⟩ = 80 G and ⟨ | Bz | ⟩ = 0.5 G snapshots.
Current usage metrics show cumulative count of Article Views (full-text article views including HTML views, PDF and ePub downloads, according to the available data) and Abstracts Views on Vision4Press platform.
Data correspond to usage on the plateform after 2015. The current usage metrics is available 48-96 hours after online publication and is updated daily on week days.
Initial download of the metrics may take a while.