Fig. 2
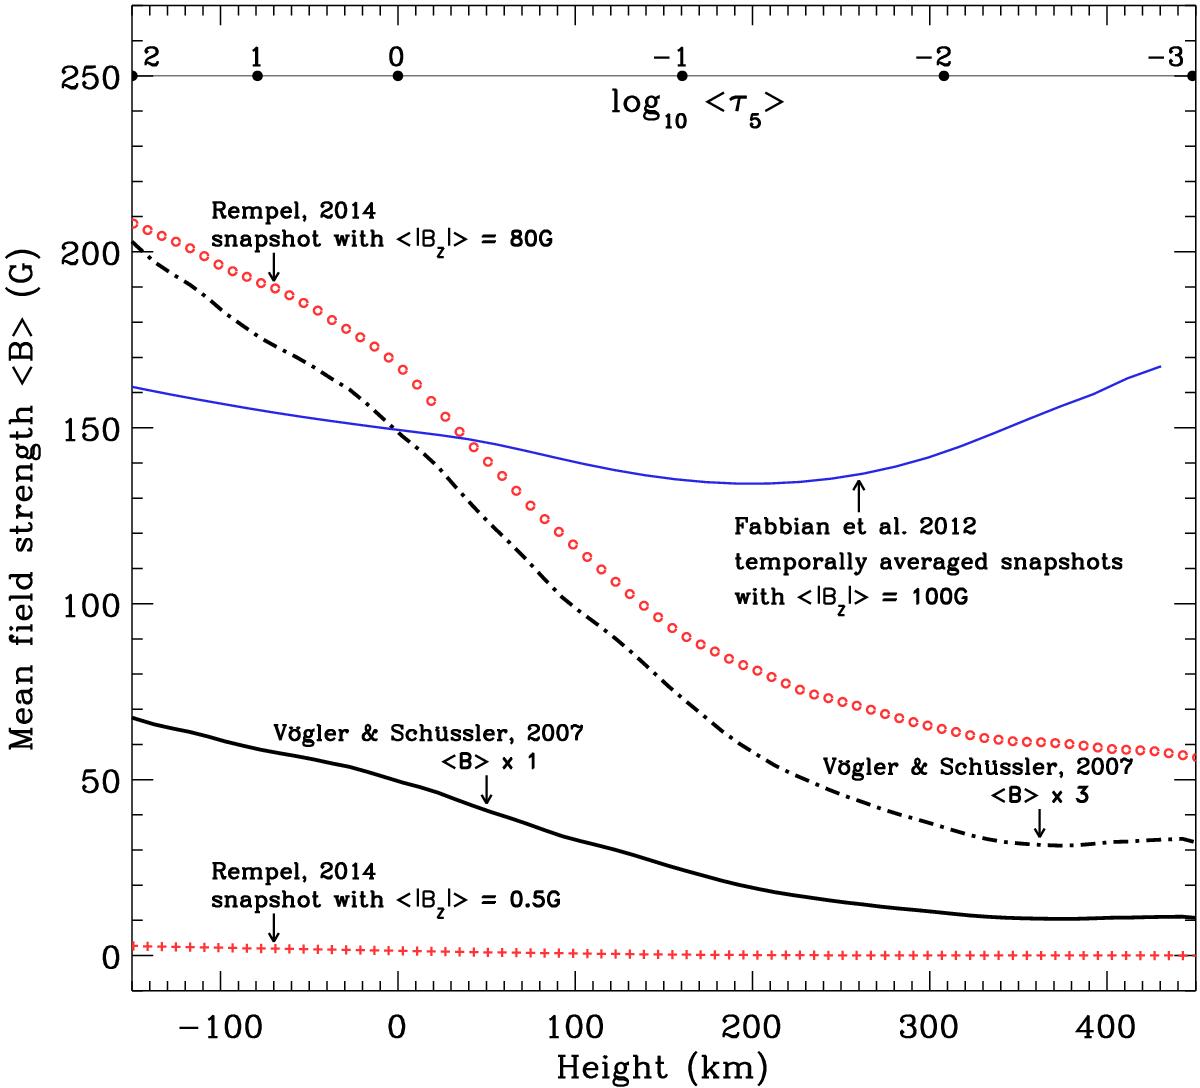
Variation with height of the mean field strength ⟨ B ⟩ in several MHD models of the quiet solar photosphere. The black curves (solid and dashed-dotted) show the height variation of ⟨ B ⟩ that results from scaling factors F = 1 and F = 3 (see details in Shchukina & Trujillo Bueno 2011) of the magnetic strength in a MHD snapshot model resulting from the small-scale dynamo simulations by Vögler & Schüssler (2007). Red circles and crosses show the ⟨ B ⟩ values in the two snapshots we took from the small-scale dynamo simulations by Rempel (2014), with ⟨ | Bz | ⟩ = 80 G and ⟨ | Bz | ⟩ = 0.5 G. In both small-scale dynamo models, the net magnetic flux is zero. The thin blue solid curve corresponds to the time average of the ⟨ | Bz | ⟩ = 100 G model of Fabbian et al. (2012), which has a non-zero net flux and resulted from magneto-convection simulations without small-scale dynamo action. The top horizontal axis gives the mean optical depths log10 ⟨ τ5 ⟩ in the ⟨ | Bz | ⟩ = 80 G model of Rempel (2014), corresponding to the atmospheric heights given in the bottom horizontal axis.
Current usage metrics show cumulative count of Article Views (full-text article views including HTML views, PDF and ePub downloads, according to the available data) and Abstracts Views on Vision4Press platform.
Data correspond to usage on the plateform after 2015. The current usage metrics is available 48-96 hours after online publication and is updated daily on week days.
Initial download of the metrics may take a while.