Fig. 1
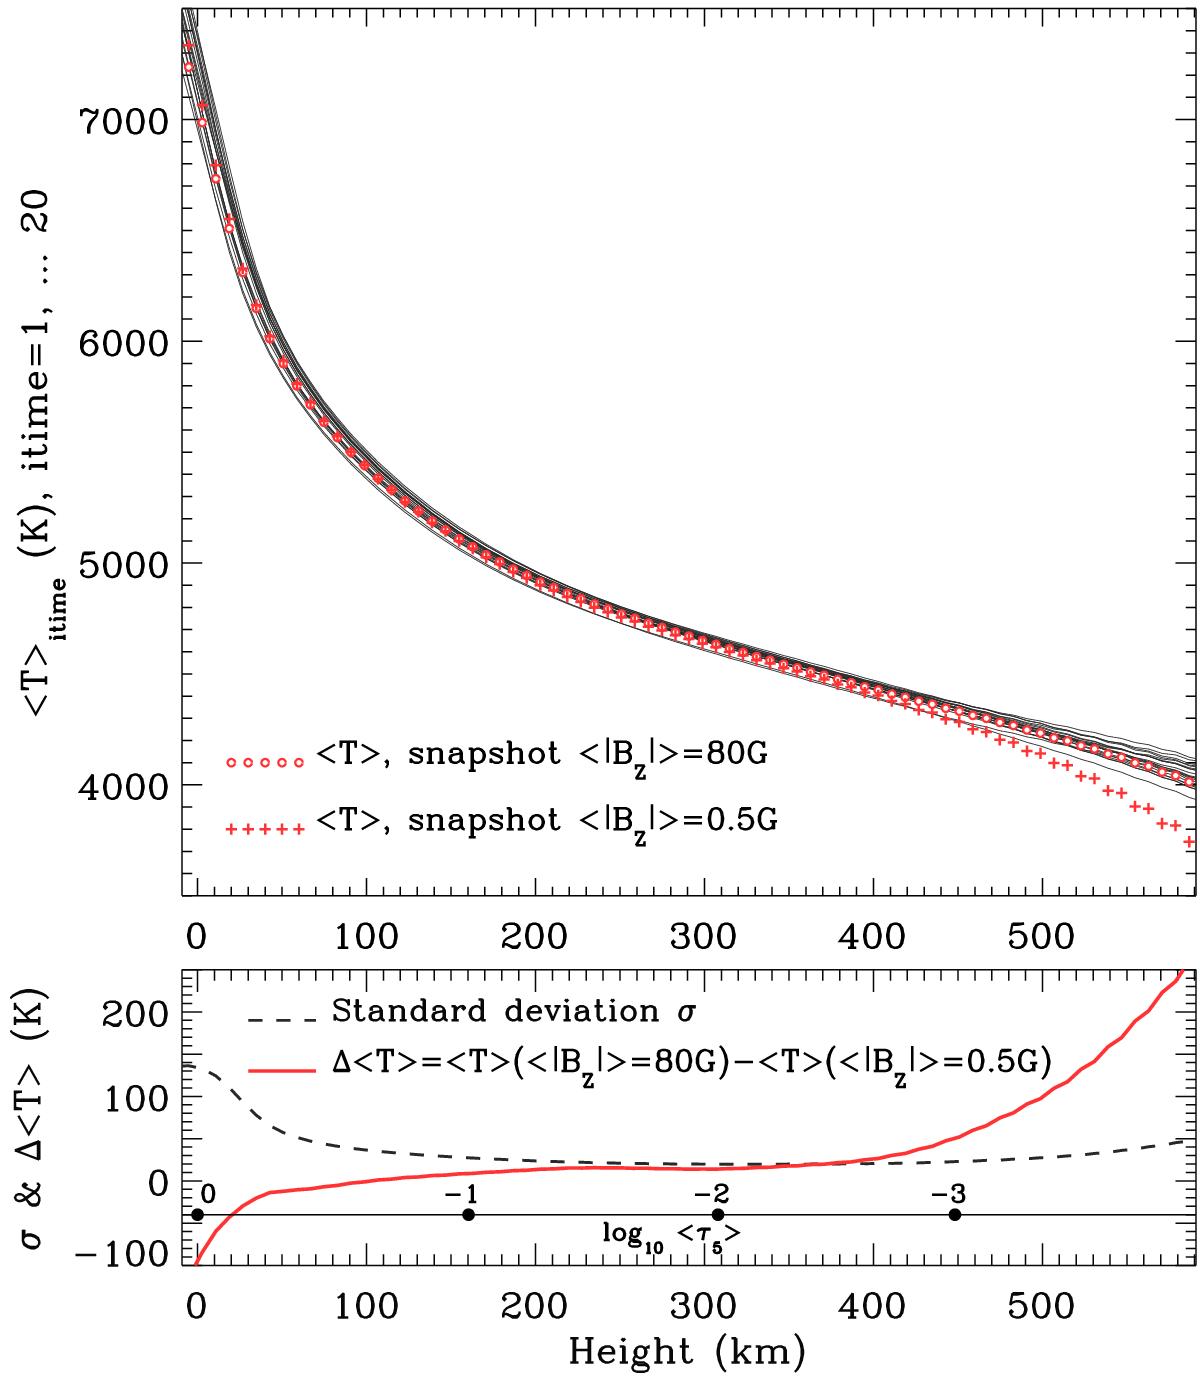
Variation with height in the mean temperature ⟨ T ⟩ in several snapshots taken from the magneto-convection simulations with small-scale dynamo action by Rempel (2014). The ⟨ T ⟩ values correspond to the horizontal averages at each height in these snapshots. Top panel: temporal evolution of the mean temperature in time series snapshots with unsigned vertical mean field strength ⟨ | Bz | ⟩ = 80 G (thin gray curves). The curves are separated by a 120-solar-second time interval, and they cover 40 min of the stationary regime. Open red circles and red crosses indicate the snapshot models with ⟨ | Bz | ⟩ = 80 G and ⟨ | Bz | ⟩ = 0.5 G used in this study. Bottom panel: temperature differences Δ ⟨ T ⟩ between the two snapshot models with ⟨ | Bz | ⟩ = 80 G and ⟨ | Bz | ⟩ = 0.5 G (solid red curve). The dashed curve indicates the height variation of the standard deviation σ in the temperature, calculated from the spatially and temporally averaged value in the time series snapshots with ⟨ | Bz | ⟩ = 80. The second horizontal axis gives the mean optical depths log10 ⟨ τ5 ⟩ in the ⟨ | Bz | ⟩ = 80 G model of Rempel (2014), corresponding to the atmospheric heights given in the bottom horizontal axis.
Current usage metrics show cumulative count of Article Views (full-text article views including HTML views, PDF and ePub downloads, according to the available data) and Abstracts Views on Vision4Press platform.
Data correspond to usage on the plateform after 2015. The current usage metrics is available 48-96 hours after online publication and is updated daily on week days.
Initial download of the metrics may take a while.