Fig. 3
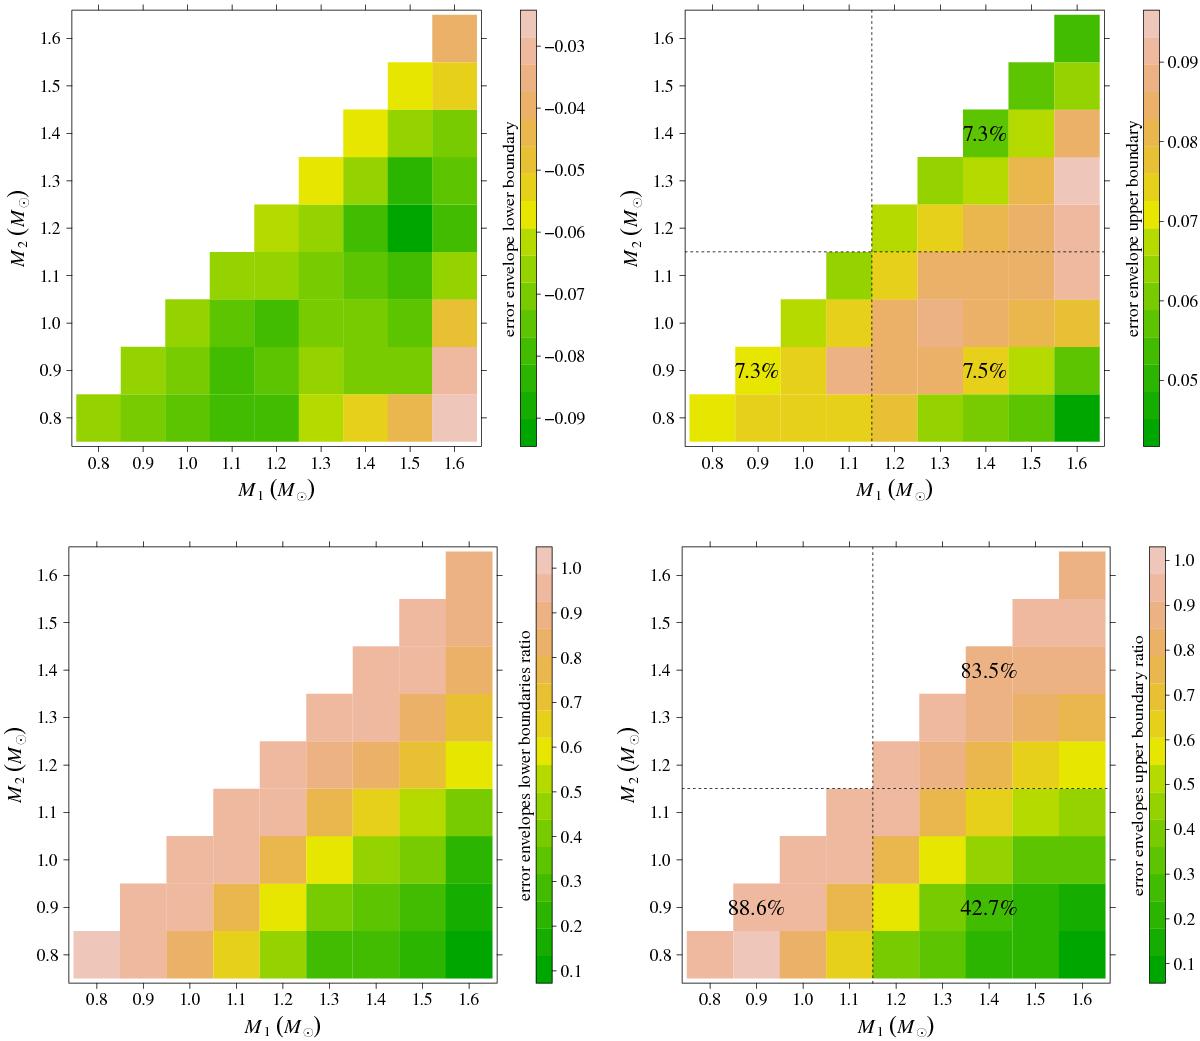
Upper row: left lower boundary of the 1σ 2D relative error envelope for joint likelihood estimates as a function of the mass of the binary system stars. The percentages on the plot refer to mean values in different ranges of mass (see text). Right: same as the left panel, but for the upper boundary of the 2D relative error envelope. Lower row: left ratio of lower boundary of the 1σ 2D relative error envelope due to different recovery techniques. The ratio is computed by dividing the position of the joint likelihood estimates boundary by the corresponding value obtained averaging the independently estimated ages. Right: same as the left panel, but for the upper boundary of the 2D relative error envelope.
Current usage metrics show cumulative count of Article Views (full-text article views including HTML views, PDF and ePub downloads, according to the available data) and Abstracts Views on Vision4Press platform.
Data correspond to usage on the plateform after 2015. The current usage metrics is available 48-96 hours after online publication and is updated daily on week days.
Initial download of the metrics may take a while.