Free Access
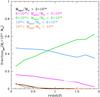
Fig. 9
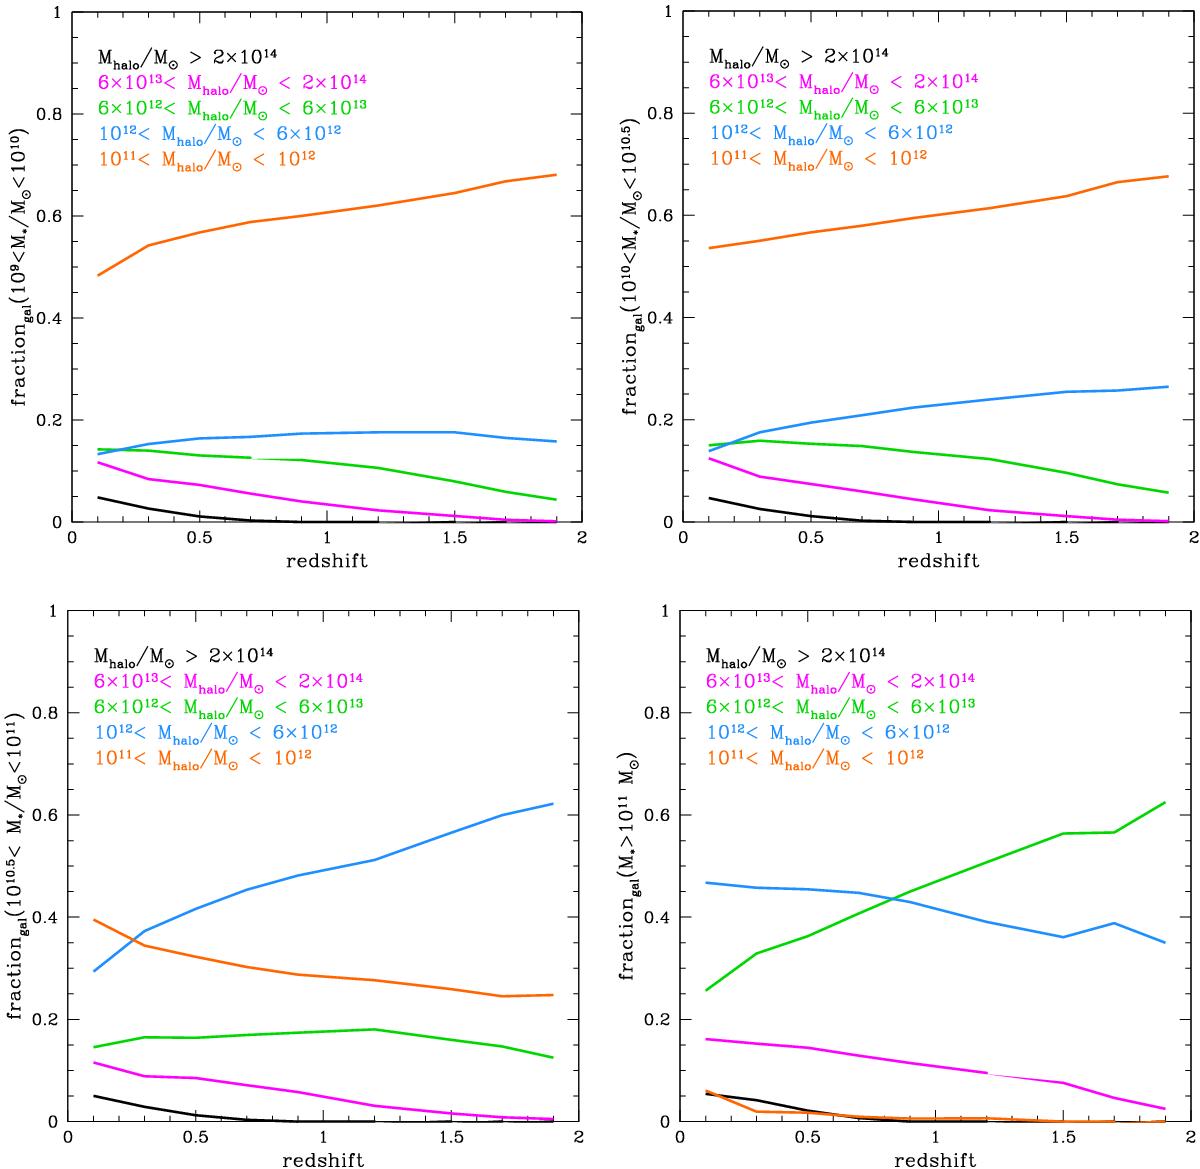
Fraction of galaxies belonging to parent halos of different masses. Each panel shows a different stellar mass range: M⋆/M⊙ = 109−1010upper left, 1010−1010.5upper right, 1010.5−1011bottom left, and >1011bottom right. Different colors label different parent halo masses, as indicated in each panel.
This figure is made of several images, please see below:
Current usage metrics show cumulative count of Article Views (full-text article views including HTML views, PDF and ePub downloads, according to the available data) and Abstracts Views on Vision4Press platform.
Data correspond to usage on the plateform after 2015. The current usage metrics is available 48-96 hours after online publication and is updated daily on week days.
Initial download of the metrics may take a while.