Fig. 8
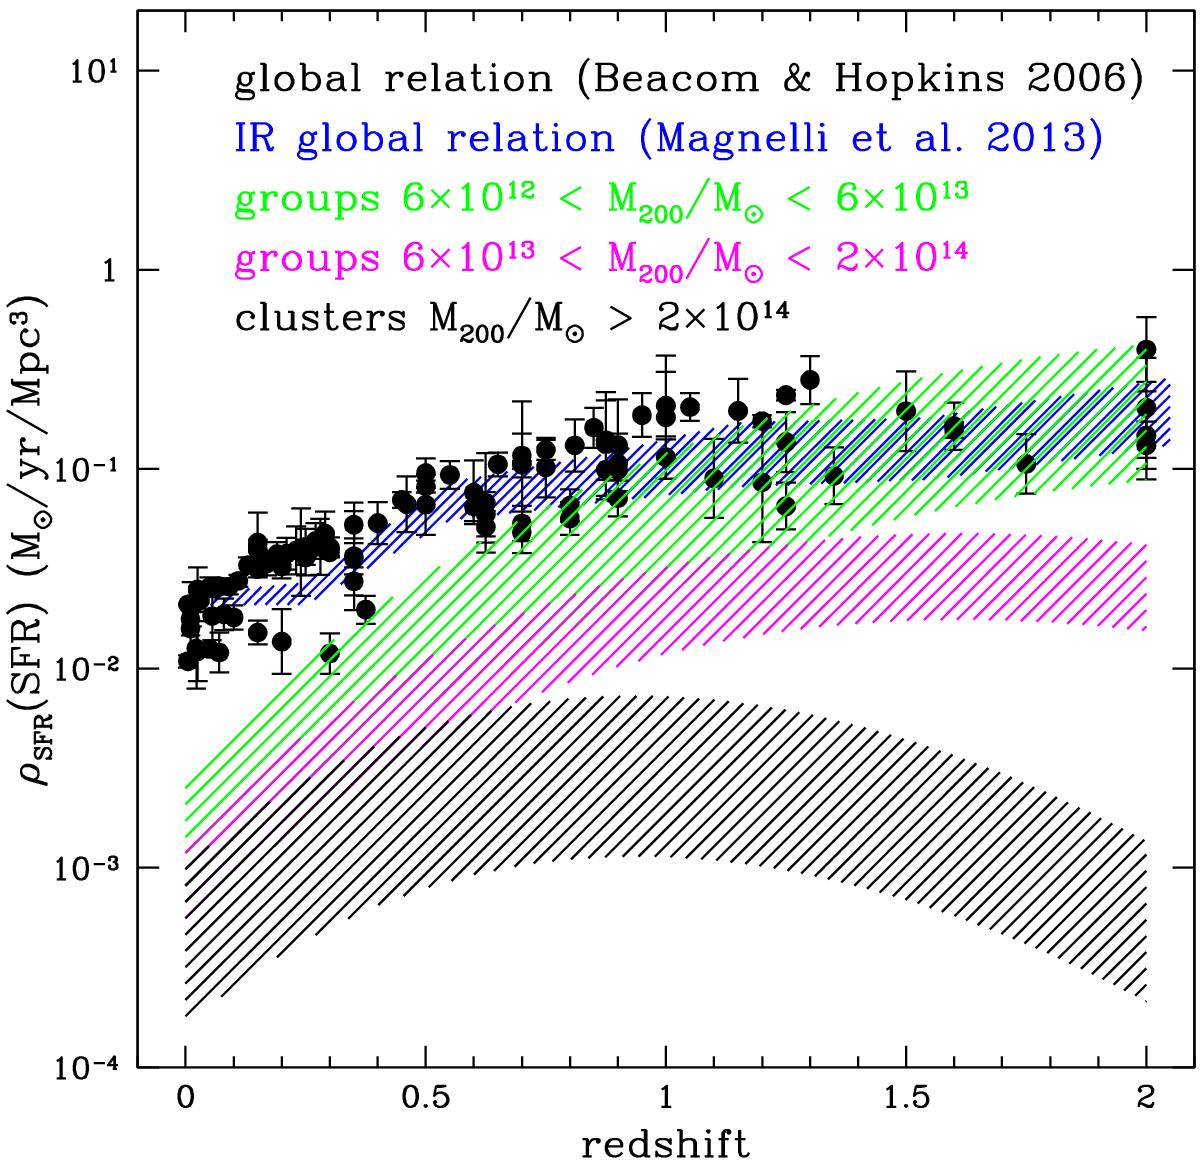
Contribution of each halo mass range to the CSFH as a function of redshift. The CSFH of the Universe is taken from Magnelli et al. (2013). The shading indicates the 1σ confidence level as derived in Magnelli et al. (2013). The shaded green, magenta, and black regions show the contributions of the low mass group, high mass group, and cluster galaxy populations, respectively. The black points show the compilation of Hopkins & Beacom (2006).
Current usage metrics show cumulative count of Article Views (full-text article views including HTML views, PDF and ePub downloads, according to the available data) and Abstracts Views on Vision4Press platform.
Data correspond to usage on the plateform after 2015. The current usage metrics is available 48-96 hours after online publication and is updated daily on week days.
Initial download of the metrics may take a while.