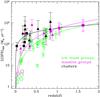
Fig. 4
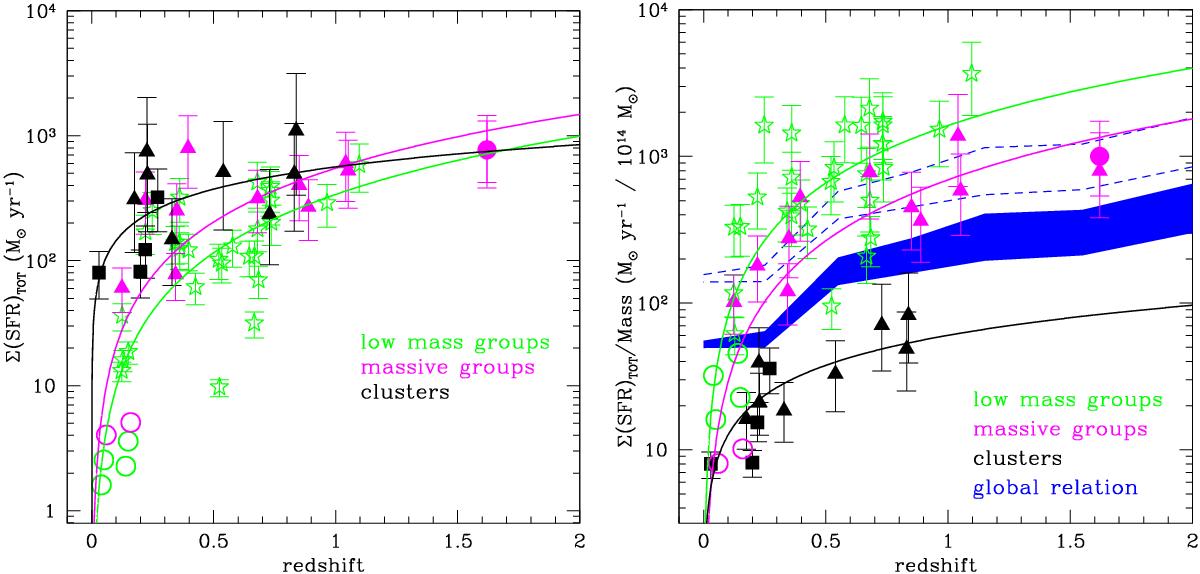
Left panel: Σ(SFR)-redshift relation for low mass groups (green symbols), massive groups (magenta symbols), and clusters (black symbols) up to redshift ~1.6. The group and cluster sample of Popesso et al. (2012, 2015) are shown with triangles. The stacked groups of Guo et al. (2014) are shown with empty circles. The stacked clusters of Haines et al. (2013) and the Coma cluster of Bai et al. (2006) are indicated with filled squares. The Kurk et al. (2008) group is shown with a triangle, while the Smail et al. (2014) structure is shown with a filled circle. The green, magenta, and black solid lines show the low mass group, massive group, and cluster best fit relation of the form Σ(SFR)∝ zα, respectively. Right panel: -redshift relation for the same sample. The color coding and the symbols have the same meaning as in the left panel. The overall -redshift relation is derived from Magnelli et al. (2013) and is shown by the blue shaded region. The shading represents 1σ confidence levels as reported in Magnelli et al. (2013). This region is moved 0.4 dex up (two dashed blue lines) to indicate its locus under the assumption that not all the mass in the considered volume is locked in halos, as claimed by Faltenbacher et al. (2010).
Current usage metrics show cumulative count of Article Views (full-text article views including HTML views, PDF and ePub downloads, according to the available data) and Abstracts Views on Vision4Press platform.
Data correspond to usage on the plateform after 2015. The current usage metrics is available 48-96 hours after online publication and is updated daily on week days.
Initial download of the metrics may take a while.