Fig. 14
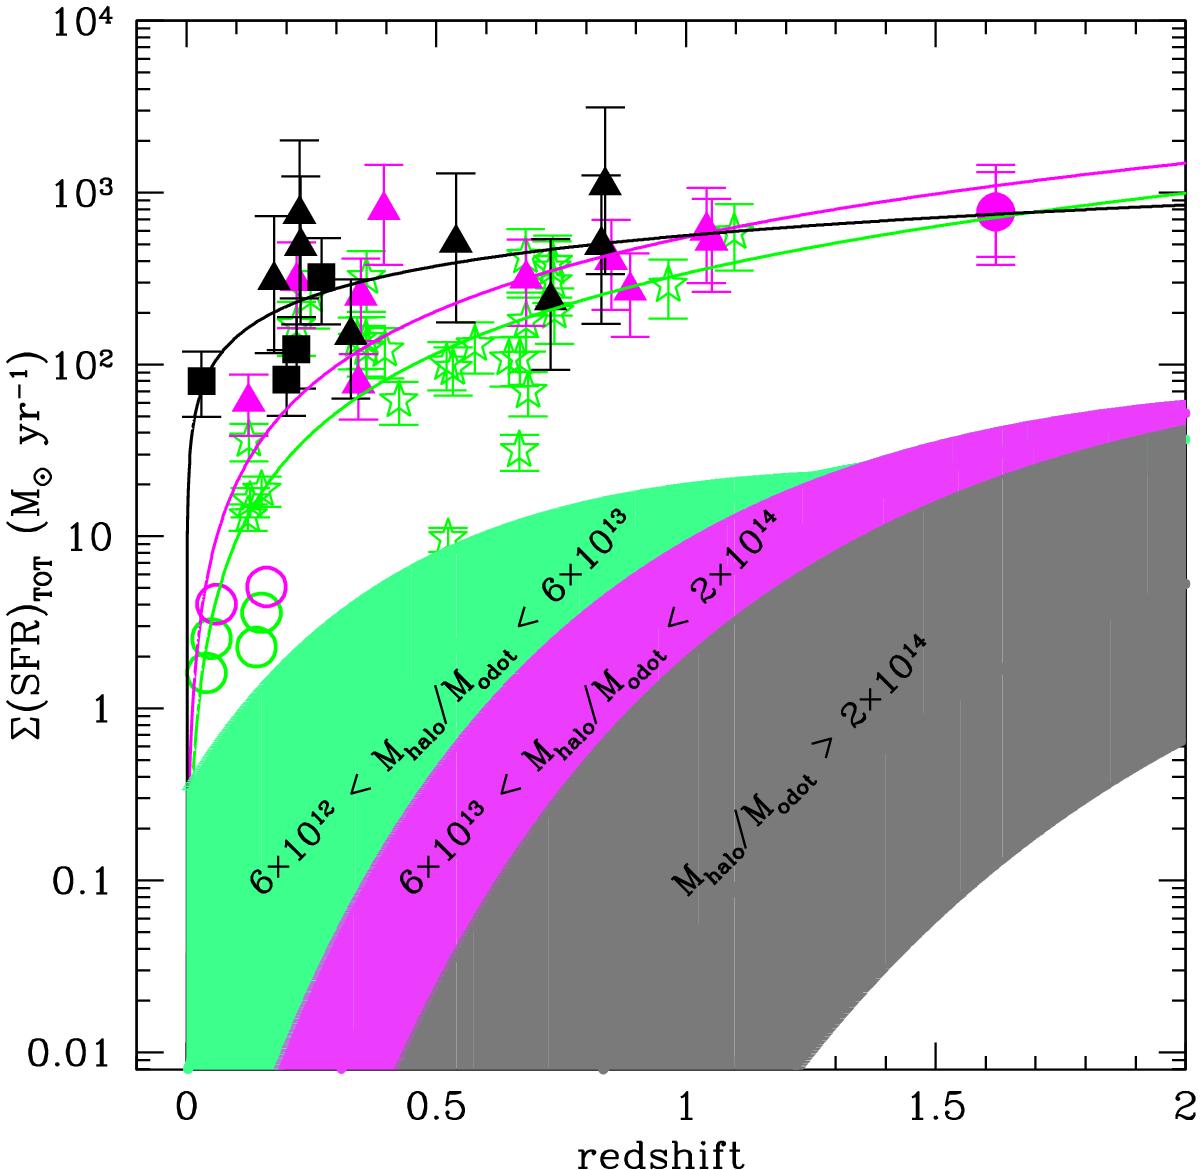
Σ(SFR)-redshift relation obtained from the MEAM model of Moster et al. (2013). The symbols and solid lines in the figure have the same meaning as in the left panel of Fig. 4. The shaded regions indicate the evolution of the SFR in DM halos with mass at redshift ~0 in the range 6 × 10¹² < Mhalo/M⊙ < 6 × 10¹³ (light green), 6 × 10¹³ < Mhalo/M⊙ < 2 × 10¹⁴ (light magenta), and Mhalo/M⊙ > 2 × 10¹⁴ (gray).
Current usage metrics show cumulative count of Article Views (full-text article views including HTML views, PDF and ePub downloads, according to the available data) and Abstracts Views on Vision4Press platform.
Data correspond to usage on the plateform after 2015. The current usage metrics is available 48-96 hours after online publication and is updated daily on week days.
Initial download of the metrics may take a while.