Fig. 13
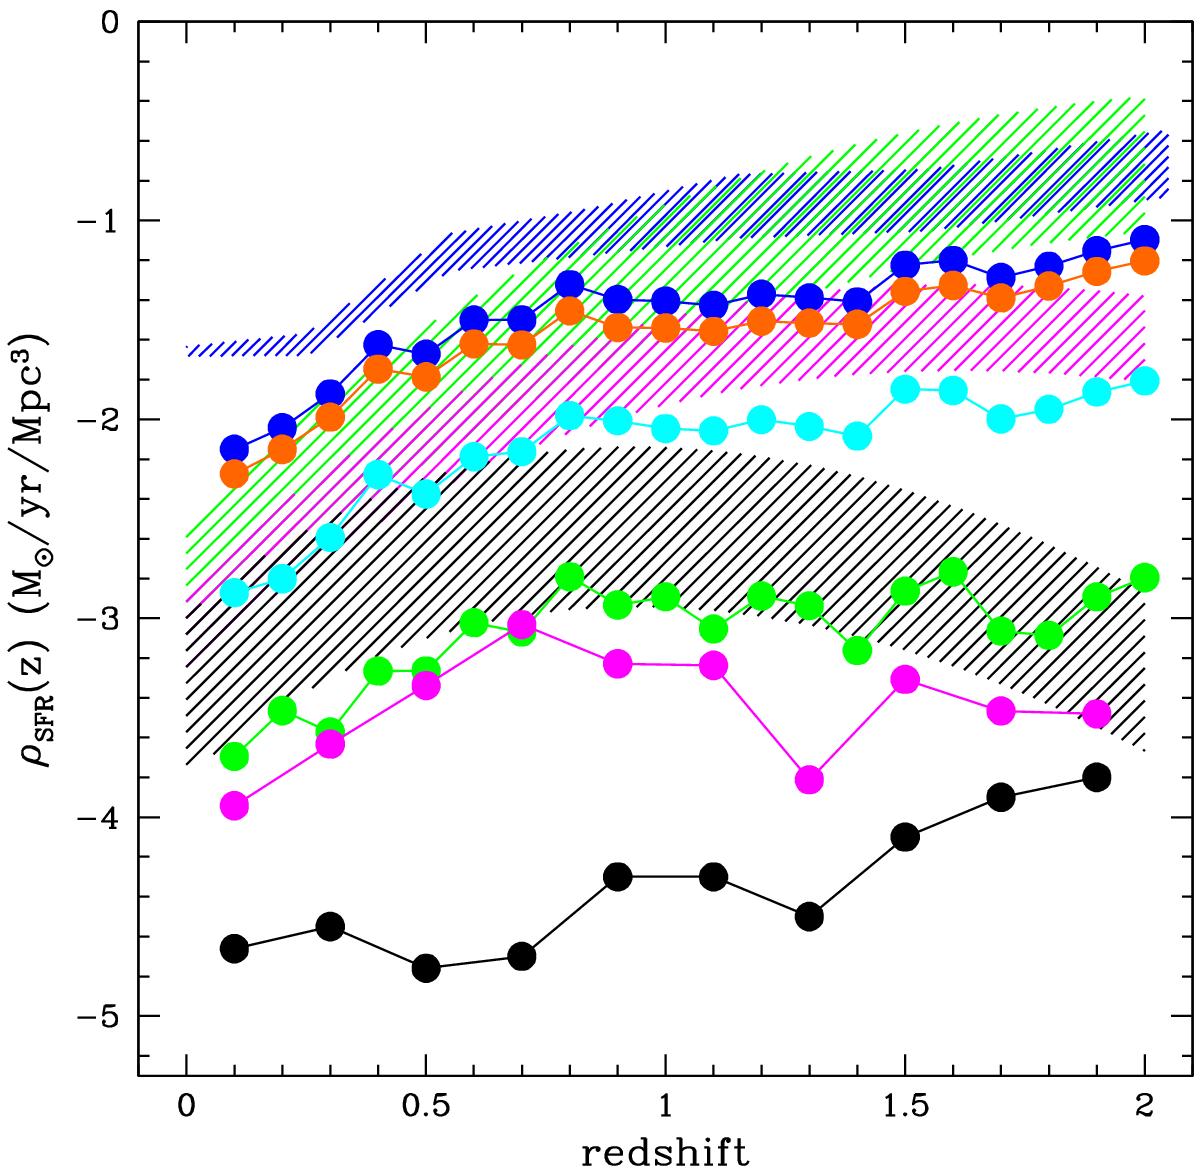
Contribution of halos of different mass to the CSFH as obtained from the semi-analytical model of De Lucia et al. (2006) applied to the Millennium simulation (filled points). Different colors correspond to halos of different masses. The color coding is the same as in Fig. 12. The shaded green, magenta, and black regions show the observed contribution of low mass group, massive group, and cluster, galaxy population, respectively to the overall relation of Magnelli et al. (2013, blue shaded region).
Current usage metrics show cumulative count of Article Views (full-text article views including HTML views, PDF and ePub downloads, according to the available data) and Abstracts Views on Vision4Press platform.
Data correspond to usage on the plateform after 2015. The current usage metrics is available 48-96 hours after online publication and is updated daily on week days.
Initial download of the metrics may take a while.