Fig. 12
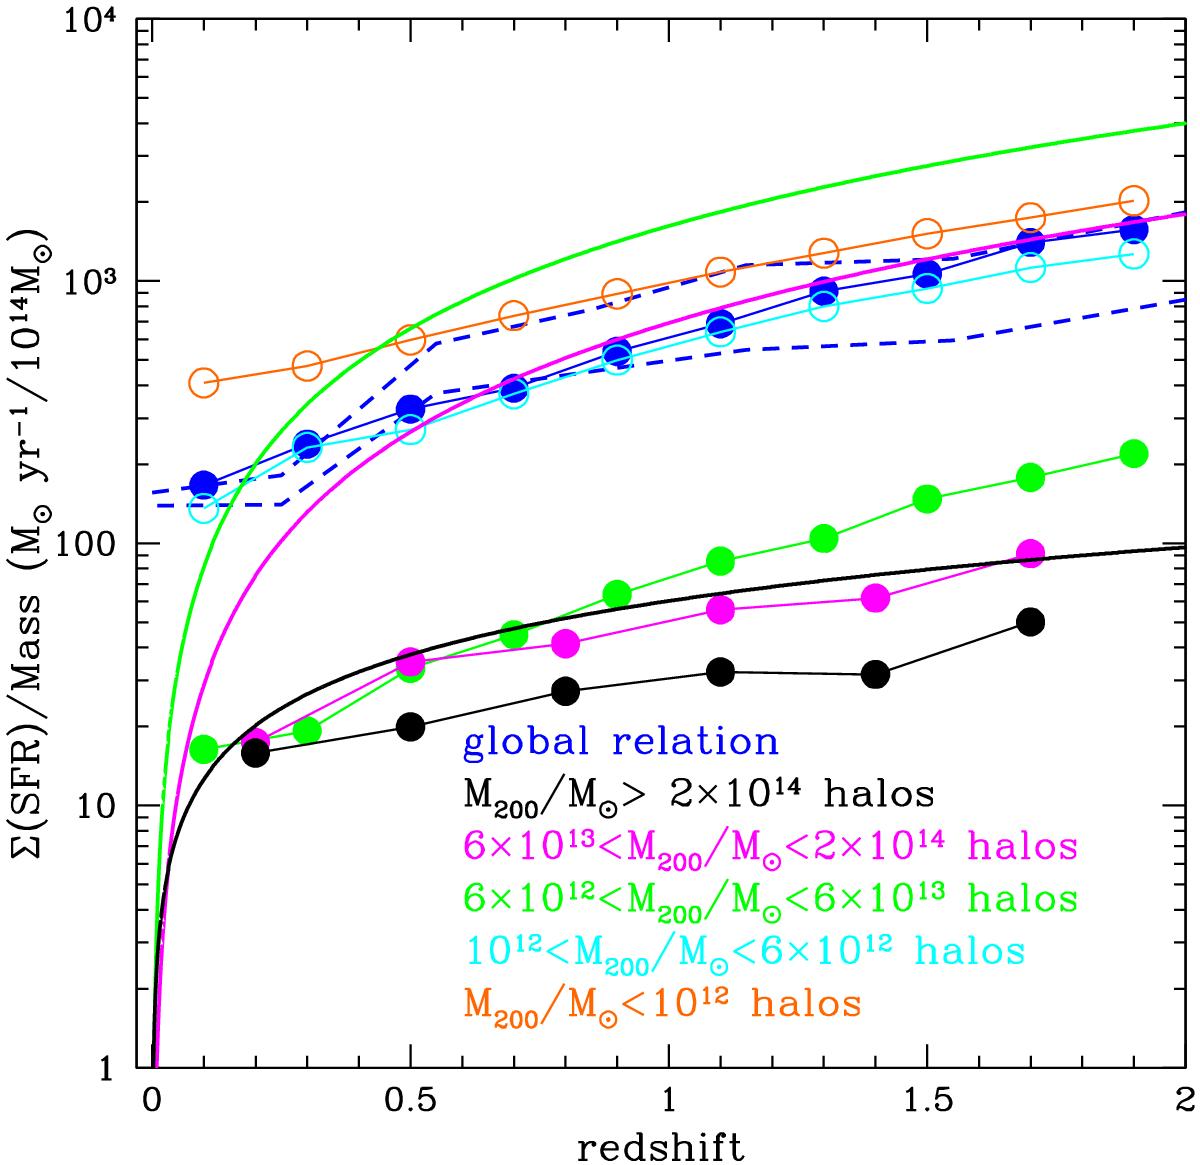
-redshift relation obtained from the semi-analytical model of De Lucia et al. (2006) applied to the Millennium simulation (filled and empty points). Different colors correspond to halos of different masses, as indicated in the figure. The region contained within the dashed blue line indicates the overall relation obtained from the overall SFR density evolution of Magnelli et al. (2013) as shown in the right panel of Fig. 4. We plot here the overall -redshift relation that considered that not all the mass is locked in halos. The solid lines show the observed best fit -redshift relations shown in the right panel of Fig. 4.
Current usage metrics show cumulative count of Article Views (full-text article views including HTML views, PDF and ePub downloads, according to the available data) and Abstracts Views on Vision4Press platform.
Data correspond to usage on the plateform after 2015. The current usage metrics is available 48-96 hours after online publication and is updated daily on week days.
Initial download of the metrics may take a while.