Free Access
Fig. 11
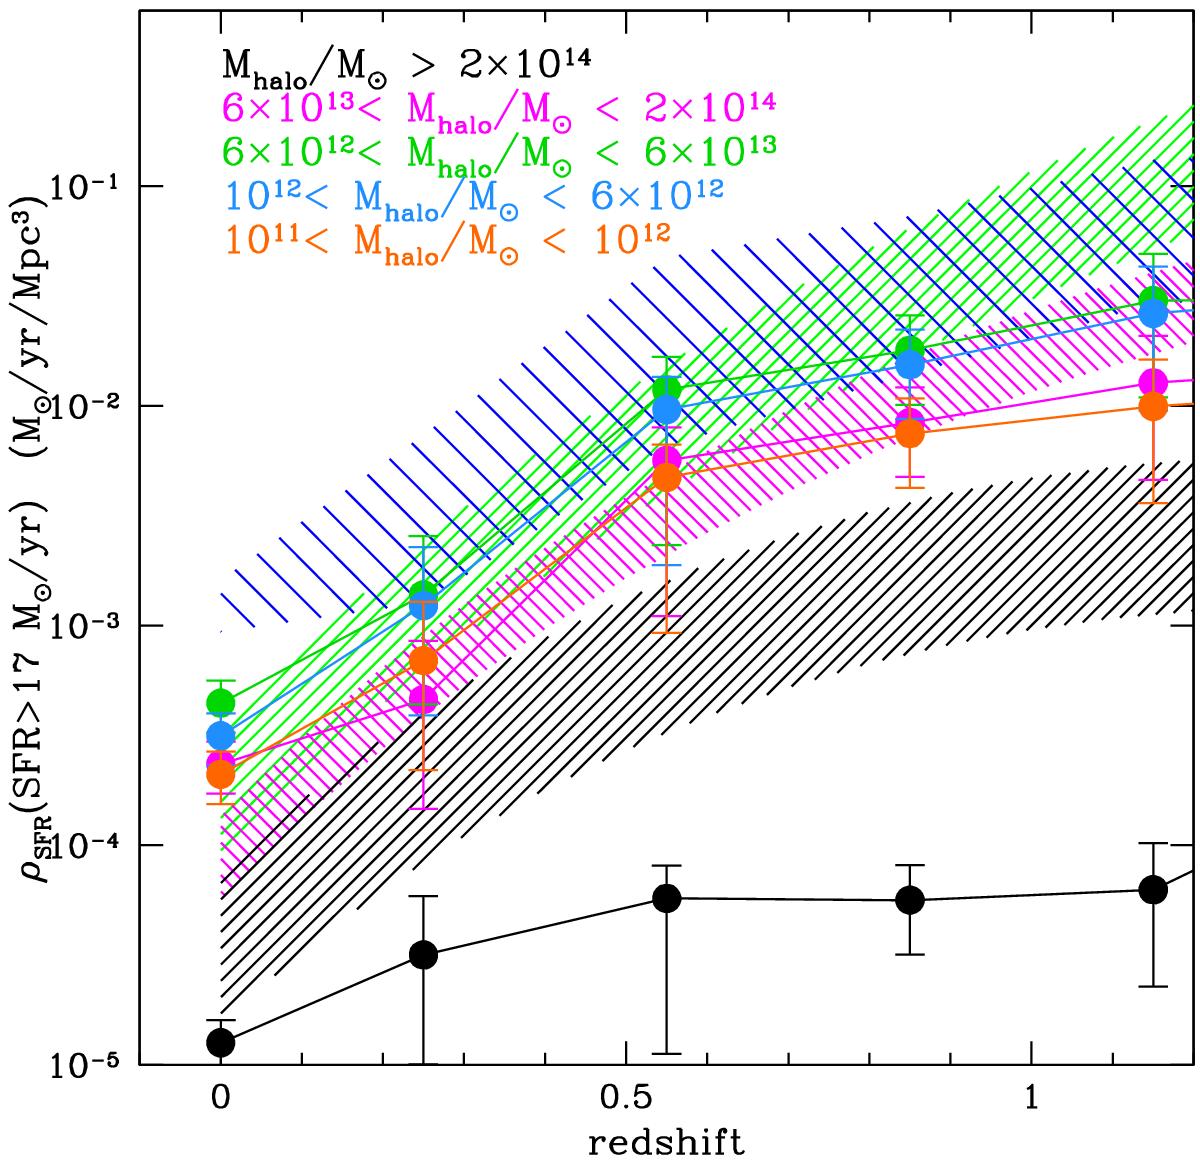
CSFH per halo mass limited to the LIRG population. The shaded regions are the CSFH per halo mass as in the left panel of Fig. 8. The points are the contributions per halo mass as estimated in the current analysis. Colors indicate different halo mass ranges as indicated in the figure.
Current usage metrics show cumulative count of Article Views (full-text article views including HTML views, PDF and ePub downloads, according to the available data) and Abstracts Views on Vision4Press platform.
Data correspond to usage on the plateform after 2015. The current usage metrics is available 48-96 hours after online publication and is updated daily on week days.
Initial download of the metrics may take a while.