Fig. 1
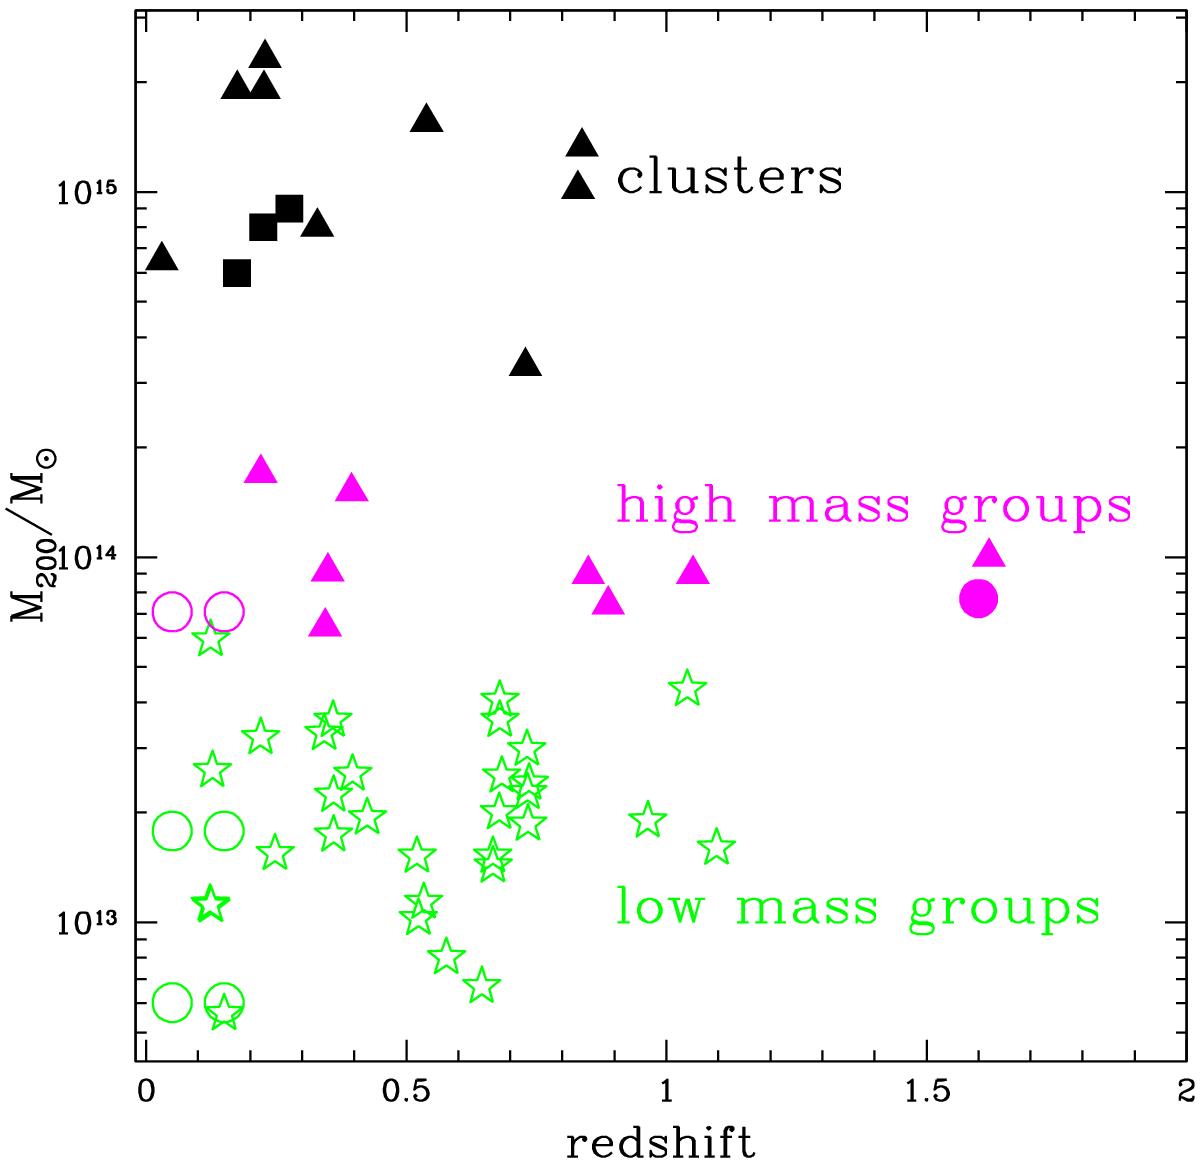
Total mass (M200) versus redshift of the group and cluster samples. The low mass (poor) groups (6 × 10¹² < M200 < 6 × 10¹³ M⊙) are identified by the green symbols. The high mass (rich) groups (6 × 10¹³ < M200 < 2 × 10¹⁴ M⊙) are identified by the magenta symbols. Black symbols show the sample of clusters, all with M200 > 2 × 10¹⁴ M⊙. The stacked groups of Guo et al. (2014) are shown with a empty circles. The stacked clusters of Haines et al. (2013) are shown with filled squares. The high redshift group of Smail et al. (2014) is shown with a filled point. Green stars and filled magenta triangles show the low mass and high mass groups of Popesso et al. (2015), respectively. Filled black triangles show the cluster sample of Popesso et al. (2012) with the addition of the Coma cluster of Bai et al. (2006). The typical error of M200 for the low and high mass group samples is on the order of 0.2 dex, so much smaller than the M200 bin size considered in this analysis. The typical error of the bright clusters is on the order of 10% in the totality of the cases.
Current usage metrics show cumulative count of Article Views (full-text article views including HTML views, PDF and ePub downloads, according to the available data) and Abstracts Views on Vision4Press platform.
Data correspond to usage on the plateform after 2015. The current usage metrics is available 48-96 hours after online publication and is updated daily on week days.
Initial download of the metrics may take a while.