Free Access
Fig. 8
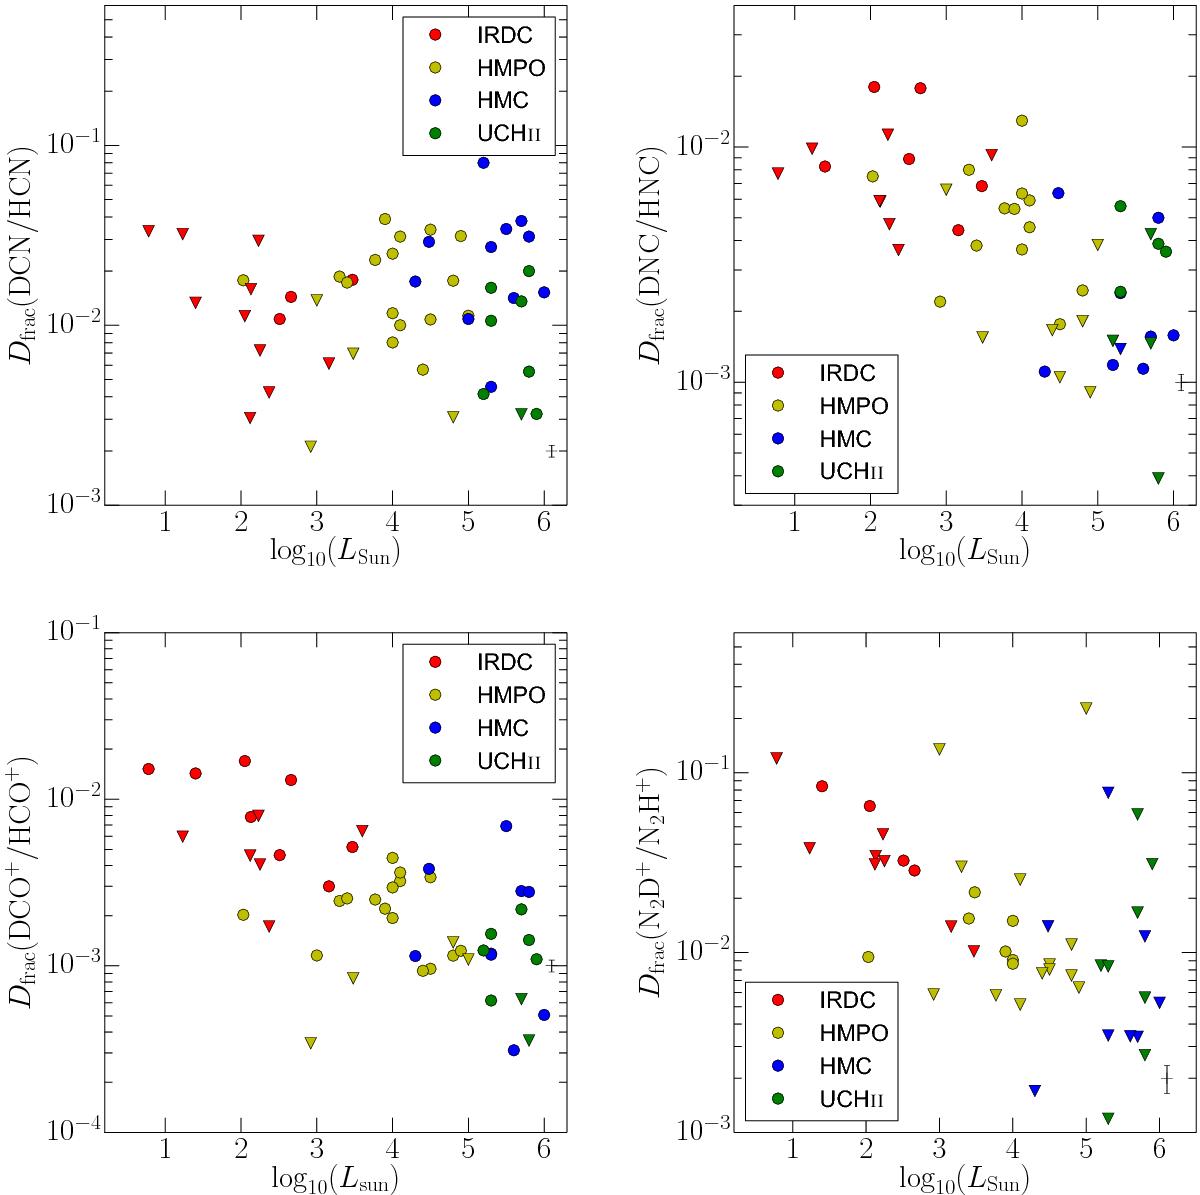
Deuteration fractions of HCN, HNC, HCO+ and N2H+ vs. the luminosity of the source. The dots mark detections, the triangles upper limits. The typical size of an error bar from the uncertainty in the integrated flux is given in the lower right.
Current usage metrics show cumulative count of Article Views (full-text article views including HTML views, PDF and ePub downloads, according to the available data) and Abstracts Views on Vision4Press platform.
Data correspond to usage on the plateform after 2015. The current usage metrics is available 48-96 hours after online publication and is updated daily on week days.
Initial download of the metrics may take a while.