Fig. 6
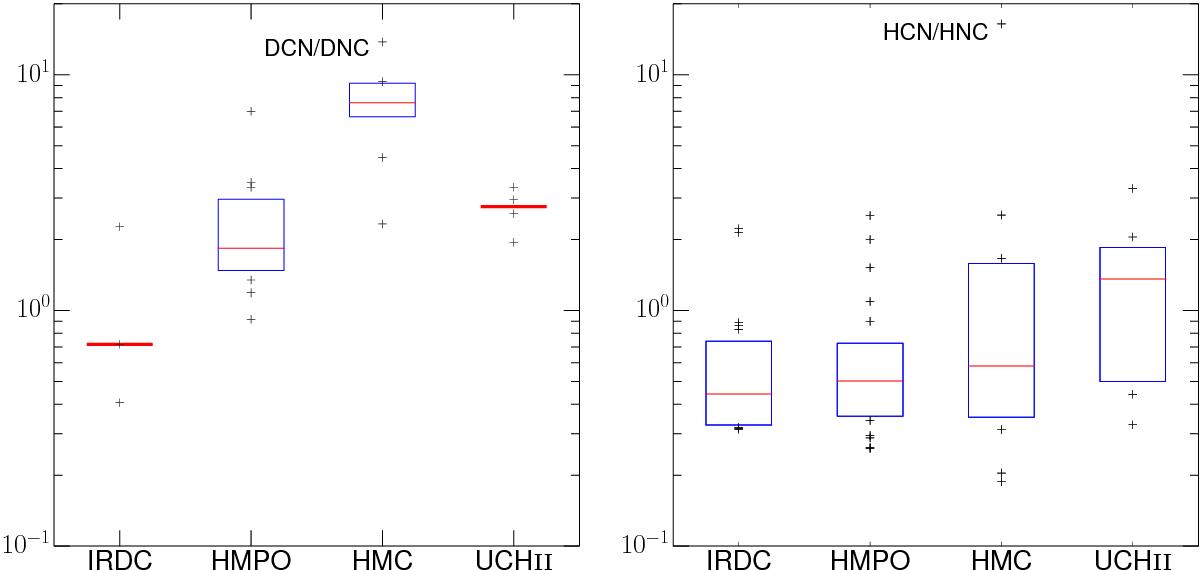
Spread in fractions in the four evolutionary stages for DCN/DNC and HCN/HNC for detections in both molecules only. If there are six or more detections within one stage, the blue box shows the 25−75% range and the crosses mark the other 50% of the data points. If there are fewer than six data points, only the individual data points are shown. The red solid line shows the median of the ratio of detections in both molecules.
Current usage metrics show cumulative count of Article Views (full-text article views including HTML views, PDF and ePub downloads, according to the available data) and Abstracts Views on Vision4Press platform.
Data correspond to usage on the plateform after 2015. The current usage metrics is available 48-96 hours after online publication and is updated daily on week days.
Initial download of the metrics may take a while.