Free Access
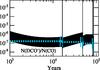
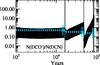
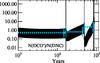
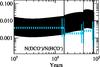
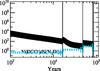
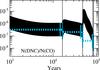
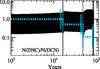
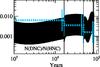
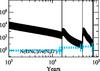
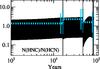
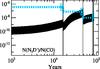
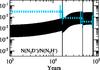
Fig. 12
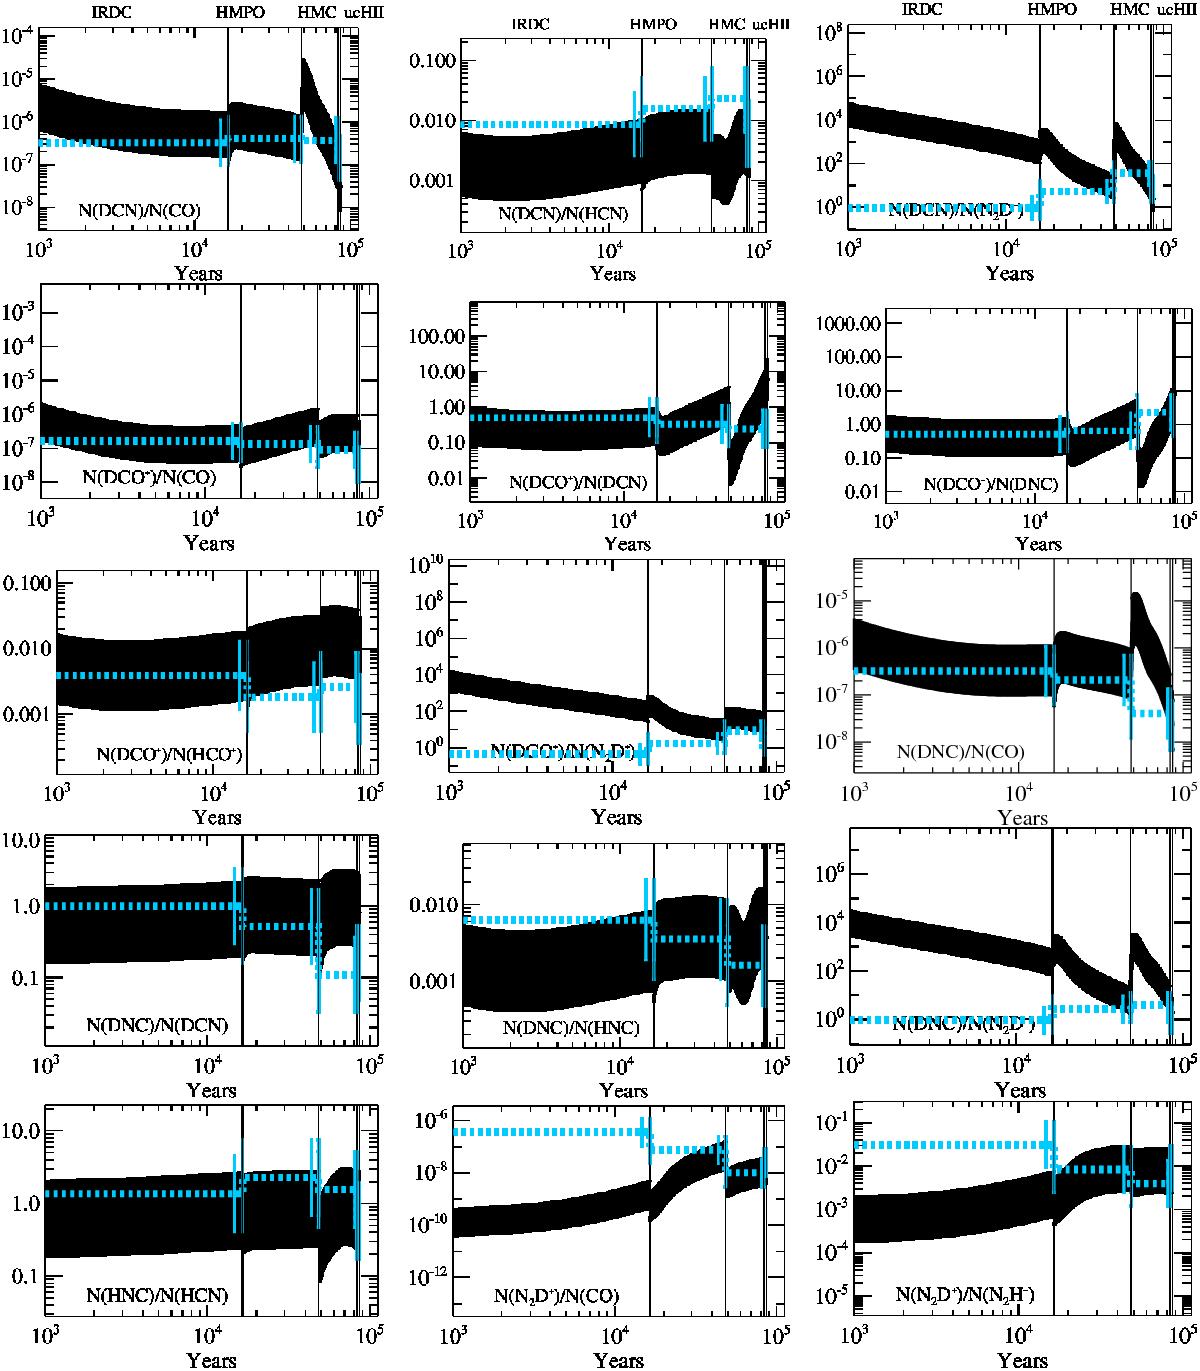
Modeled and observed column density ratios are plotted for all stages. The modeled values are shown by the black solid line, the observed values show the median of all detections and upper limits, and are depicted by the blue dashed line. The error bars are indicated by the vertical marks.
This figure is made of several images, please see below:
Current usage metrics show cumulative count of Article Views (full-text article views including HTML views, PDF and ePub downloads, according to the available data) and Abstracts Views on Vision4Press platform.
Data correspond to usage on the plateform after 2015. The current usage metrics is available 48-96 hours after online publication and is updated daily on week days.
Initial download of the metrics may take a while.