Free Access
Fig. 10
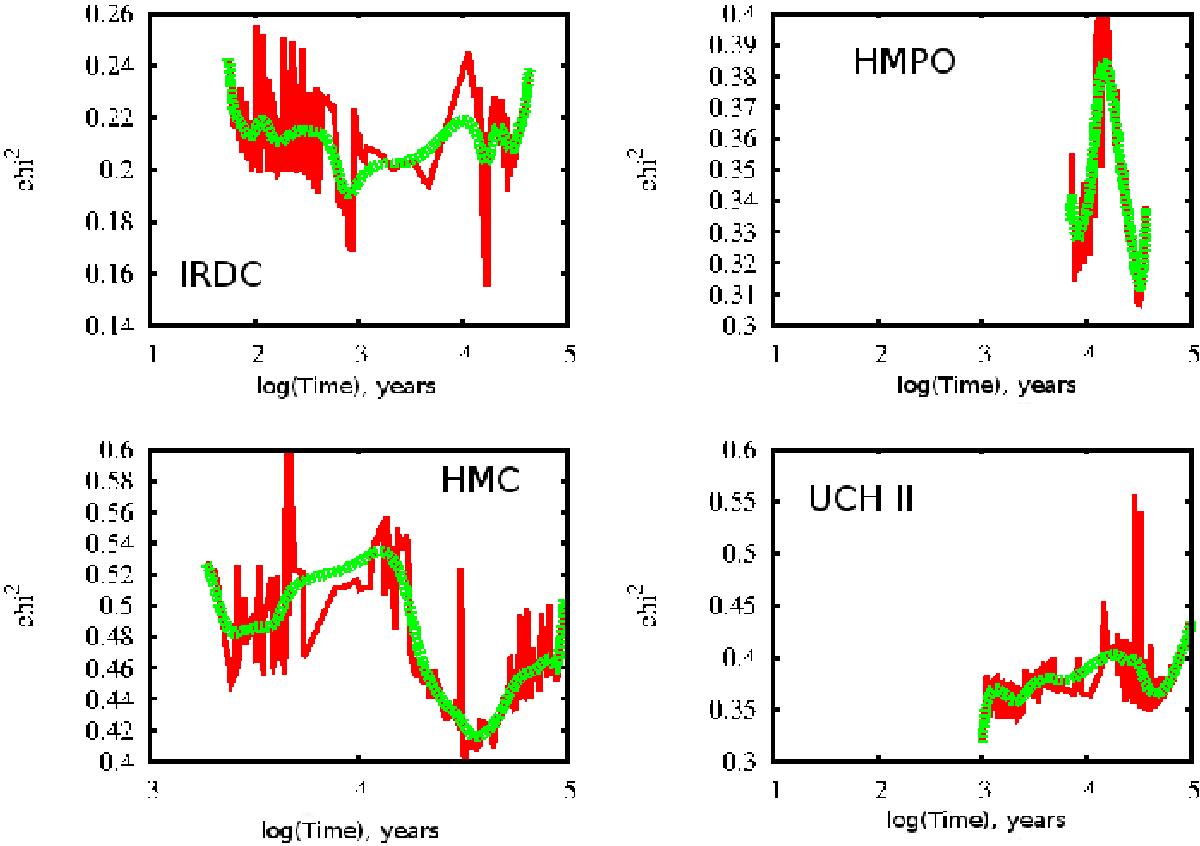
Evolution of the minimum χ2 of the best-fit models with time. The four panels show the four different stages IRDC (upper left), HMPO (upper right), HMC (lower left), and UCHii (lower right). The red curve marks the calculated values at all 299 time moments, the green curve shows their smoothed spline interpolation.
Current usage metrics show cumulative count of Article Views (full-text article views including HTML views, PDF and ePub downloads, according to the available data) and Abstracts Views on Vision4Press platform.
Data correspond to usage on the plateform after 2015. The current usage metrics is available 48-96 hours after online publication and is updated daily on week days.
Initial download of the metrics may take a while.