| Issue |
A&A
Volume 578, June 2015
|
|
|---|---|---|
| Article Number | L3 | |
| Number of page(s) | 5 | |
| Section | Letters | |
| DOI | https://doi.org/10.1051/0004-6361/201526262 | |
| Published online | 02 June 2015 | |
B fields in OB stars (BOB): FORS 2 spectropolarimetric follow-up of the two rare rigidly rotating magnetosphere stars HD 23478 and HD 345439⋆,⋆⋆
1
Leibniz-Institut für Astrophysik Potsdam (AIP),
An der Sternwarte 16,
14482
Potsdam, Germany
e-mail: This email address is being protected from spambots. You need JavaScript enabled to view it.
2
European Southern Observatory, Karl-Schwarzschild-Str. 2, 85748
Garching,
Germany
3
Argelander-Institut für Astronomie, Universität
Bonn, Auf dem Hügel
71, 53121
Bonn,
Germany
4
Institut d’Astrophysique et de Géophysique, Université de
Liège, Allée du 6 Août, Bât.
B5c, 4000
Liège,
Belgium
5
Universität Potsdam, Institut für Physik und
Astronomie, 14476
Potsdam,
Germany
6
Institute for Astro- and Particle Physics, University of
Innsbruck, Technikerstr.
25/8, 6020
Innsbruck,
Austria
7
Department of Astronomy, University of Florida,
2011 Bryant Space Center,
Gainesville, FL
32611,
USA
Received:
5
April
2015
Accepted:
7
May
2015
Abstract
Aims. Massive B-type stars with strong magnetic fields and fast rotation are very rare and pose a mystery for theories of star formation and magnetic field evolution. Only two such stars, called σ Ori E analogues, were known until recently. A team involved in APOGEE, one of the Sloan Digital Sky Survey III programs, announced the discovery of two additional rigidly rotating magnetosphere stars, HD 23478 and HD 345439. The magnetic fields in these newly discovered σ Ori E analogues have not been investigated so far.
Methods. In the framework of our ESO Large Programme and one normal ESO programme, we carried out low-resolution FORS 2 spectropolarimetric observations of HD 23478 and HD 345439.
Results. In the measurements of hydrogen lines, we discover a rather strong longitudinal magnetic field of up to 1.5 kG in HD 23478 and up to 1.3 kG using the entire spectrum. The analysis of HD 345439 using four subsequent spectropolarimetric subexposures does not reveal a magnetic field at a significance level of 3σ. On the other hand, individual subexposures indicate that HD 345439 may host a strong magnetic field that rapidly varies over 88 min. The fast rotation of HD 345439 is also indicated by the behaviour of several metallic and He i lines in the low-resolution FORS 2 spectra that show profile variations already on this short time-scale.
Key words: stars: early-type / stars: fundamental parameters / stars: variables: general / stars: magnetic field / stars: individual: HD 23478 / stars: individual: HD 345439
Based on observations obtained in the framework of the ESO Prgs. 191.D-0255(E) and 094.D-0355(B).
Appendix A is available in electronic form at http://www.aanda.org
© ESO, 2015
1. Introduction
The increasing rate of detections of magnetic fields in massive stars during the past years generates a strong motivation to study correlations between evolutionary state, rotation velocity, and surface composition (e.g. Brott et al. 2011; Potter et al. 2012) with the aim of understanding the origin and role of magnetic fields in massive stars. Recent observations indicate that magnetic fields may be responsible for a wide range of phenomena observed in massive stars, such as chemical peculiarity, periodic UV wind-line variability, cyclic variability in Hα and He II λ4686, excess emission in UV-wind lines, and unusual X-ray emission (e.g. Schnerr et al. 2008; Oskinova et al. 2011a). The variability is most likely due to material that is guided by the large-scale magnetic field that corotates with the star (e.g. Groote & Hunger 1982). To properly understand and model all these phenomena, the knowledge of the magnetic field behaviour in massive stars, that is, its configuration, strength, and variability, is of utmost importance.
Summary of the results obtained for HD 23478 and HD 345439 from the analysis of the hydrogen lines and of the entire spectrum.
A rigidly rotating magnetosphere in the early B-type stars HD 23478 and HD 345439 was recently discovered in the Apache Point Observatory Galactic Evolution Experiment (APOGEE; Eikenberry et al. 2014) using high-resolution (R ~ 22 500) near-infrared H-band spectra. The authors detected prominent Brackett series emission lines with broad double-horned profiles in the APOGEE bandpass, which are characteristic for a rigidly rotating magnetosphere (RRM) such as was found in the prototype star σ Ori E (see their Fig. 4). The strong magnetic field and fast rotation led to the formation of a centrifugally supported magnetosphere with rotationally modulated hydrogen-line emission explained within the RRM model (e.g. Townsend et al. 2005). Of the three stars σ Ori E, HD 23478, and HD 345439, the latter appears to display the strongest RRM feature. Eikenberry et al. (2014) reported that the optical spectra of HD 23478 and HD 345439 obtained with the Hobby-Eberly Telescope at a medium resolving power of 18 000 indicate a classification B3IV for the former star and B1V–B2V for the latter. While they determined a v sin i value for HD 23478 of about 125 ± 20 km s-1, HD 345439, in contrast, appears to be one of the fastest rotators known among magnetic main-sequence stars with v sin i ~ 270 ± 20 km s-1. Furthermore, the authors reported that HD 23478 exhibits a broad Hα RRM signature, while for HD 345439 the Hα profile shows a slight bump on the red side.
In this work, we present spectropolarimetric follow-up observations of HD 23478 and HD 345439 obtained in the framework of our B fields in OB stars (BOB) collaboration (Morel et al. 2014) using the FOcal Reducer low dispersion Spectrograph 2 (FORS 2) mounted on the 8 m Antu telescope of the VLT. We intend to search for strong magnetic fields in the two stars that were implicitly detected through the RRM interpretation of their NIR spectra by Eikenberry et al. (2014).
2. Magnetic field measurements using FORS 2 spectropolarimetry
Low-resolution FORS 2 observations for HD 23478 and HD 345439 were obtained in 2014 on
November 17 and June 2, respectively. FORS 2 is a multi-mode instrument equipped with
polarisation-analysing optics comprising super-achromatic half-wave and quarter-wave phase
retarder plates and a Wollaston prism with a beam divergence of 22″ in standard resolution mode. We employed the
GRISM 600B and the narrowest available slit width of
0 4
to obtain a spectral resolving power of R ~ 2000. The use of the mosaic detector with a
pixel size of 15 μm allowed us to cover a spectral range from 3250 to
6215 Å, which includes all Balmer lines except for Hα and numerous He i
lines. A detailed description of the procedure used for the mean longitudinal magnetic
field measurements from low-resolution FORS 2 spectropolarimetry is presented in the
Appendix.
4
to obtain a spectral resolving power of R ~ 2000. The use of the mosaic detector with a
pixel size of 15 μm allowed us to cover a spectral range from 3250 to
6215 Å, which includes all Balmer lines except for Hα and numerous He i
lines. A detailed description of the procedure used for the mean longitudinal magnetic
field measurements from low-resolution FORS 2 spectropolarimetry is presented in the
Appendix.
The results of the magnetic field measurements carried out using independent reduction and measurement packages are listed in Table 1. For the first software package developed in Bonn, the uncertainty on the ⟨Bz⟩ and ⟨Nz⟩ values is the χ2-scaled uncertainty (Bagnulo et al. 2012), while the uncertainty determined by the second software package developed in Potsdam in addition involves the bootstrapping results. In each column, the numbers σB and σN after the ⟨Bz⟩ and ⟨Nz⟩ values refer to the sigma detection.
A strong magnetic field at a significance level of more than 10σ was achieved for HD 23478 using the hydrogen lines and the entire spectrum. Using the first software package, we obtain ⟨Bz⟩ = −1302 ± 59 G for the whole spectrum and ⟨Bz⟩hyd = −1477 ± 95 G, while using the second software package, we measure ⟨Bz⟩ = −1139 ± 84 G and ⟨Bz⟩hyd = −1347 ± 114 G. For both reduction packages the magnetic field values obtained for each pair of position angles separated by 90° show negative polarity, are all consistent with each other and are of similar order. No significant fields were detected in the null spectra calculated by combining the subexposures in such a way that the intrinsic source polarization cancels out, yielding a diagnostic null N spectrum. Figure 1 presents the main graphical output of the Bonn pipeline, showing the clear magnetic field detection obtained form analysing the hydrogen lines of HD 23478.
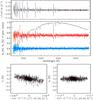 |
Fig. 1 Graphical output of the IRAF/IDL Bonn pipeline obtained from the analysis of the FORS 2 data of the hydrogen lines of HD 23478. The top panel presents the derivative of Stokes I. The regions used to calculate the magnetic field are marked by a thick blue line centred at zero. In the middle panel, the top spectrum presents the Stokes I spectrum arbitrarily normalised to the highest value, the middle red spectrum corresponds to the Stokes V spectrum (in %), while the bottom blue spectrum is the N spectrum (in %). The green asterisks drawn on the Stokes V and N spectra mark the points that have been removed by the sigma clipping. The pale blue strip drawn behind the N spectrum shows the uncertainty associated with each spectral point. As a double-check of the statistical consistency of the data and uncertainties, the thick green bar on the left side of the N spectrum shows the standard deviation of the N profile. In the bottom left panel, we present the linear fit used to determine the magnetic field value using Stokes V (i.e. ⟨Bz⟩). The red solid line shows the best fit. From the linear fit we obtain ⟨Bz⟩ = −1477 ± 95 G. In the bottom right panel, we present the same as in the bottom left panel, but for the null profile (i.e. ⟨Nz⟩). From the linear fit, we obtain ⟨Nz⟩ = 30 ± 64 G. |
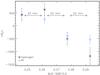 |
Fig. 2 Variation of the ⟨Bz⟩ value obtained for HD 345439 from the analysis of the hydrogen lines (black asterisks) and of the whole spectrum (blue rhombuses). Between each point is a time span of about 22 min. |
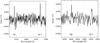 |
Fig. 3 Left-side panel: Stokes V spectrum of HD 345439 in the vicinity of Hγ and He iλ4471 obtained from combining the first two subexposure pairs. The shape of the Zeeman features indicates a longitudinal magnetic field of positive polarity. Right-side panel: Stokes V spectrum of HD 345439 in the vicinity of Hβ and He iλ4922 lines obtained from combining the last two subexposure pairs. The shape of the Zeeman features indicates a longitudinal magnetic field of negative polarity. |
Using four consecutive observations obtained with pairs of position angles separated by 90°, we obtained a clear non-detection in the analysis of HD 345439; this is presented in the second line in Table 1. However, after splitting the observations into two data sets, that is, using the first two pairs and the second two pairs consisting of observations at the retarder waveplate positions [− 45°, + 45°, + 45°,−45°], we obtain 3.0 to 3.8σ detections shown in the third and fourth lines of the table. The fact that the first and second data-sets led to opposite ⟨Bz⟩ values, though almost equal in modulus, led to a non-detection in the measurements using the whole available data set. This behaviour might be suggestive of a very fast rotating star with a magnetic field axis inclined relative to the rotation axis. Given the apparent fast and strong variation of the value of the longitudinal magnetic field, we then decided to measure the magnetic field using each individual pair obtained at the retarder waveplate positions [− 45°, + 45°] and separated by roughly 22 min. The results are presented in the last four lines of Table 1. In this case, the null profile cannot be extracted, since the measurements were made using observations at just two position angles. We also note that no sigma clipping was adopted for this specific analysis because the sigma clipping is applied on the basis of the null profile. Figure 2 shows the variation of the ⟨Bz⟩ value obtained from the analysis of the hydrogen lines and of the entire spectrum using the first software package developed in Bonn. We discover that the mean longitudinal magnetic field measured on hydrogen lines changes from about +500 G measured in the first subexposure pair to about −1200 G measured in the last subexposure pair. Using the second software package developed in Potsdam, we obtained a similar magnetic field behaviour, but with somewhat different absolute values of the field. The detections are achieved at a significance level of 3 to 3.6σ in two subexposures. In Fig. 3, we present Stokes V spectra obtained for the combinations of the first two subexposure pairs and for the last two subexposure pairs in the vicinity of the hydrogen and He i lines. The different shape of the Zeeman features indicates that the magnetic field polarity has changed after the second subexposure. We note that none of the tests we performed on the data indicated relevant systematic noise. Nevertheless, it is important to obtain more spectropolarimetric data in the future to confirm this behaviour.
An indication for the fast rotation of HD 345439 is also given by the behaviour of several metallic and He i lines in the low-resolution FORS 2 spectra, showing profile variations already on a time scale of 88 min. In Fig. 4, we present the behaviour of the Si iii λ4553 and the He i λ4388 and He i λ4471 lines in the FORS 2 Stokes I spectra obtained for each subexposure pair recorded with a time lapse of 22 min. The profile of the Si iii line becomes asymmetric in the last subexposure pair, that is, at the time when we observe a negative field polarity. We note, however, that the level of variability of the Si iii λ4553 line profile is not significantly higher than that in neighbouring continuum regions. On the other hand, similar asymmetric profiles of Si lines are detected in our Fiber-fed Extended Range Optical Spectrograph (FEROS) spectrum of σ Ori E obtained in the framework of the ESO programme 091.C-0713(A). The intensity of the He i λ4388 and He i λ4471 lines is lower in the phase when the polarity of the field is positive and increases when the field is negative. This fast spectral and longitudinal magnetic field variability suggests that the rotation period probably is very short, probably shorter than one day. The rapid change in the strength of the mean longitudinal magnetic field by about 1 kG over 88 min in HD 345439 is reminiscent of the mean longitudinal magnetic field behaviour in the fast-rotating σ Ori E analogue HR 7355 with a rotation period of 0.52 d. This star shows a field variation of about 1 kG within a phase interval of 0.1, corresponding to 75 min (see Fig. 3 in Rivinius et al. 2013). Therefore, it is possible that the rotation period of HD 345439 is also significantly shorter than one day.
No spectral variability was detected in the eight low-resolution FORS 2 spectra for HD 23478 taken within 15 min. This star was thoroughly studied photometrically by Jerzykiewicz (1993), who suggested a photometric/rotation period of 1.05 d and, using a radius estimated from the spectral type, obtained 240 km s-1 for the equatorial rotation velocity.
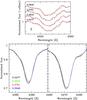 |
Fig. 4 Line profile variability of Si and He in the FORS 2 Stokes I spectra of HD 345439 obtained for each subexposure pair, i.e. with a time lapse of 22 min. The top panel presents the behaviour of the Si iii λ4553 line. The mean profile is indicated by the red dashed line. The numbers close to the plotted line profiles refer to the time of the observation calculated as MJD-56 810. The vertical bar on the left side shows the noise level. In the bottom panel we present overplotted profiles of the He i λ4388 and He i λ4471 lines. Their intensity is lower at the phase when the polarity of the field is positive and increases when the field is negative. The error bar is too small to be presented in these plots. |
3. Discussion
Our spectropolarimetric follow-up of the early B-type stars HD 23478 and HD 345439 with their recently discovered rigidly rotating magnetospheres revealed a strong longitudinal magnetic field of the order of 1.5 kG in HD 23478 using FORS 2 observations. We also found an indication for a rapidly changing magnetic field in the fast rotator HD 345439. Obviously, additional follow-up spectropolarimetric monitoring of the behaviour of the magnetic field in HD 23478 and HD 345439 is urgently needed to confirm and characterize the magnetic field topology of the two stars. Knowledge of the structure of the magnetic field is of crucial importance for understanding the nature of these stars, which belong to the group of σ Ori E analogues.
This type of stars is extremely rare: apart from σ Ori E (e.g. Groote & Hunger 1997), only two other stars, HR 5907 and HR 7355, are known to belong to this group, which is called the σ Ori E analogues (Grunhut et al. 2012; Rivinius et al. 2013). Their very strong magnetic fields and extraordinary fast rotation pose a mystery for theories of star formation and magnetic field evolution. Both stars have similar dipole strengths of the order of 10 kG and similar very short half-day rotation periods. However, the spindown time-scale via magnetic braking is expected to be much shorter than their estimated ages (e.g., Rivinius et al. 2013; Mikulášek et al. 2010).
The emission variability in hydrogen lines in the σ Ori E analogues suggests that gas is trapped in magnetospheric clouds. The high strength of the magnetic fields that control the stellar winds and fast rotation makes this type of stars a test case for models of X-ray production. Only low-resolution X-ray spectra were so far measured for three members of this group, σ Ori E, HR 5907, and HR 7355 (e.g., Petit et al. 2013; Nazé et al. 2014). We retrieved and analysed these archival XMM-Newton and Chandra observations using most recent calibrations. Our analysis of the X-ray spectra of HR 5907 and HR 7355 shows that these stars are even harder X-ray sources than σ Ori E; the emission-measure-weighted temperature of the hot plasma in HR 5907 is 80 MK and that in HR 7355 is 60 MK, for instance. Given that the winds in magnetic B-type dwarf stars are weak, with velocities not exceeding a few hundred km s-1 (Oskinova et al. 2011b), it is very difficult to explain such high temperatures in the framework of the magnetically confined wind shock model (Babel & Montmerle 1997). On the other hand, non-thermal emission can be expected from stars with strong magnetic fields (Leto et al. 2006). Our analysis of archival data showed that non-thermal radiation in these objects is very likely (Oskinova et al., in prep.). New, already approved XMM-Newton observations of HD 345439 will probe whether hard non-thermal X-rays are present in this object and shed new light on the mechanisms of X-ray generation in strongly magnetic fast rotators.
Online material
Appendix A: Measuring the mean longitudinal magnetic field from low-resolution FORS 2 spectropolarimetry
For each star, four consecutive observations were obtained with pairs of position angles separated by 90°, namely [− 45°, + 45°, + 45°,−45°,−45°, + 45°, + 45°,−45°]. The exposure time for each position angle was 20 s for HD 23478 and 600 s for HD 345439. A peak signal-to-noise ratio (S/N) of 1900 in the final Stokes I spectrum was achieved for HD 23478, while for HD 345439 we obtained a peak S/N of ~900.
The V/I spectrum is calculated using
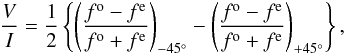 (A.1)where + 45° and − 45° indicate the position angle of the
retarder waveplate and fo and fe are the
ordinary and extraordinary beams, respectively. Null profiles, N, are calculated as
pairwise differences from all available V profiles. From these, 3σ-outliers are identified
and used to clip the V profiles. This removes spurious signals, which
mostly come from cosmic rays, and also reduces the noise. The mean longitudinal magnetic
field, ⟨Bz⟩, is measured on the rectified and
clipped spectra based on the relation
(A.1)where + 45° and − 45° indicate the position angle of the
retarder waveplate and fo and fe are the
ordinary and extraordinary beams, respectively. Null profiles, N, are calculated as
pairwise differences from all available V profiles. From these, 3σ-outliers are identified
and used to clip the V profiles. This removes spurious signals, which
mostly come from cosmic rays, and also reduces the noise. The mean longitudinal magnetic
field, ⟨Bz⟩, is measured on the rectified and
clipped spectra based on the relation 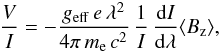 (A.2)where V is the Stokes parameter
that measures the circular polarization, I is the intensity in the unpolarised spectrum,
geff is the effective Landé factor,
e is the
electron charge, λ is the wavelength, me is the
electron mass, c is the speed of light, dI/ dλ
is
(A.2)where V is the Stokes parameter
that measures the circular polarization, I is the intensity in the unpolarised spectrum,
geff is the effective Landé factor,
e is the
electron charge, λ is the wavelength, me is the
electron mass, c is the speed of light, dI/ dλ
is
the wavelength derivative of Stokes I, and ⟨Bz⟩ is the mean longitudinal (line-of-sight) magnetic field. The longitudinal magnetic field is usually measured in two ways: using only the hydrogen Balmer lines or using the entire spectrum including all available lines.
To identify any systematic differences that could exist in treating the FORS 2 data by different research groups, the mean longitudinal magnetic field, ⟨Bz⟩, was derived in both stars using independent software packages (one developed in Bonn and the other one in Potsdam). For the first reduction, we used a suite of IRAF (Tody 1993)1 and IDL routines that follow the technique, recipes, and recommendations by Bagnulo et al. (2002; 2012; 2013)2. The determination of the mean longitudinal magnetic field using low-resolution FORS spectropolarimetry with the second software package developed in Potsdam is described by Hubrig et al. (2014; 2015) and by Schöller et al. (in prep.). In general, the measurement method is the same for both pipelines. A few minor differences refer to the clipping procedure, rectification, and the choice of the wavelength regions including the hydrogen lines.
Furthermore, Monte Carlo bootstrapping tests are carried out in the second software package (e.g. Rivinius et al. 2010). In these tests, we generate 250 000 statistical variations of the original dataset by the bootstrapping technique and analyse the resulting distribution P(⟨Bz⟩) of the regression results. Mean and standard deviation of this distribution are identified with the most likely mean longitudinal magnetic field and its 1σ error, respectively. The main advantage of this method is that it provides an independent error estimate. The measurement uncertainties for both stars obtained before and after Monte Carlo bootstrapping tests were found to agree closely, indicating the robustness of the measurement method.
Image Reduction and Analysis Facility (IRAF, http://iraf.noao.edu/) is distributed by the National Optical Astronomy Observatory, which is operated by the Association of Universities for Research in Astronomy (AURA) under cooperative agreement with the National Science Foundation.
More details about the applied data reduction and analysis procedure of FORS spectropolarimetric data will be given in a separate work (Fossati et al., in prep.).
Acknowledgments
T.M. acknowledges financial support from Belspo for contract PRODEX GAIA-DPAC. L.F. acknowledges financial support from the Alexander von Humboldt Foundation. L.M.O. is grateful for DLR grant 50 OR 1302. The authors thank Rainer Arlt, Artemio Herrero, and Fabian Schneider for useful comments.
References
- Babel, J., & Montmerle, T. 1997, A&A, 323, 121 [NASA ADS] [Google Scholar]
- Bagnulo, S., Szeifert, T., Wade, G. A., et al. 2002, A&A, 389, 191 [NASA ADS] [CrossRef] [EDP Sciences] [Google Scholar]
- Bagnulo, S., Landstreet, J. D., Fossati, L., & Kochukhov, O. 2012, A&A, 538, A129 [NASA ADS] [CrossRef] [EDP Sciences] [Google Scholar]
- Bagnulo, S., Fossati, L., Kochukhov, O., & Landstreet, J. D. 2013, A&A, 559, A103 [NASA ADS] [CrossRef] [EDP Sciences] [Google Scholar]
- Brott, I., Evans, C. J., Hunter, I., et al. 2011, A&A, 530, A116 [NASA ADS] [CrossRef] [EDP Sciences] [Google Scholar]
- Eikenberry, S. S., Chojnowski, S. D., Wisniewski, J., et al. 2014, ApJ, 784, L30 [NASA ADS] [CrossRef] [Google Scholar]
- Groote, D., & Hunger, K. 1982, A&A, 116, 64 [Google Scholar]
- Groote, D., & Hunger, K. 1997, A&A, 319, 250 [NASA ADS] [Google Scholar]
- Grunhut, J. H., Rivinius, Th., Wade, G. A., et al. 2012, MNRAS, 419, 1610 [NASA ADS] [CrossRef] [Google Scholar]
- Hubrig, S., Schöller, M., & Kholtygin, A. F. 2014, MNRAS, 440, 1779 [NASA ADS] [CrossRef] [Google Scholar]
- Hubrig, S., Schöller, M., Kholtygin, A. F., et al. 2015, MNRAS, 447, 1885 [NASA ADS] [CrossRef] [Google Scholar]
- Jerzykiewicz, M. 1993, A&AS, 97, 421 [NASA ADS] [Google Scholar]
- Leto, P., Trigilio, C., Buemi, C. S., et al. 2006, A&A, 458, 831 [NASA ADS] [CrossRef] [EDP Sciences] [Google Scholar]
- Mikulášek, Z., Krtička, J., Henry, G. W., et al. 2010, A&A, 511, L7 [NASA ADS] [CrossRef] [EDP Sciences] [Google Scholar]
- Morel, T., Castro, N., Fossati, L., et al. 2014, The Messenger. 157, 27 [NASA ADS] [Google Scholar]
- Nazé, Y., Petit, V., Rinbrand, M., et al. 2014, ApJS, 215, 10 [NASA ADS] [CrossRef] [Google Scholar]
- Oskinova, L. M., Hamann, W.-R., Cassinelli, J. P., et al. 2011a, AN, 332, 988 [NASA ADS] [Google Scholar]
- Oskinova, L. M., Todt, H., Ignace, R., et al. 2011b, MNRAS, 416, 1456 [NASA ADS] [CrossRef] [Google Scholar]
- Petit, V., Owocki, S. P., Wade, G. A., et al. 2013, MNRAS, 429, 398 [NASA ADS] [CrossRef] [Google Scholar]
- Potter, A. T., Chitre, S. M., Tout, C. A. 2012, MNRAS, 424, 2358 [NASA ADS] [CrossRef] [Google Scholar]
- Rivinius, T., Szeifert, T., Barrera, L., et al. 2010, MNRAS, 405, L46 [NASA ADS] [CrossRef] [Google Scholar]
- Rivinius, T., Townsend, R. H. D., Kochukhov, O., et al. 2013, MNRAS, 429, 177 [NASA ADS] [CrossRef] [Google Scholar]
- Schnerr, R. S., Henrichs, H. F., Neiner, C., et al. 2008, A&A, 483, 857 [NASA ADS] [CrossRef] [EDP Sciences] [Google Scholar]
- Tody, D. 1993, in Astronomical Data Analysis Software and Systems II, eds. R. J. Hanisch, R. J. V. Brissenden, & J. Barnes (San Francisco: ASP), ASP Conf. Ser., 52, 173 [Google Scholar]
- Townsend, R. H. D., Owocki, S. P., & Groote, D. 2005, ApJ, 630, L81 [NASA ADS] [CrossRef] [Google Scholar]
All Tables
Summary of the results obtained for HD 23478 and HD 345439 from the analysis of the hydrogen lines and of the entire spectrum.
All Figures
|
Fig. 1 Graphical output of the IRAF/IDL Bonn pipeline obtained from the analysis of the FORS 2 data of the hydrogen lines of HD 23478. The top panel presents the derivative of Stokes I. The regions used to calculate the magnetic field are marked by a thick blue line centred at zero. In the middle panel, the top spectrum presents the Stokes I spectrum arbitrarily normalised to the highest value, the middle red spectrum corresponds to the Stokes V spectrum (in %), while the bottom blue spectrum is the N spectrum (in %). The green asterisks drawn on the Stokes V and N spectra mark the points that have been removed by the sigma clipping. The pale blue strip drawn behind the N spectrum shows the uncertainty associated with each spectral point. As a double-check of the statistical consistency of the data and uncertainties, the thick green bar on the left side of the N spectrum shows the standard deviation of the N profile. In the bottom left panel, we present the linear fit used to determine the magnetic field value using Stokes V (i.e. ⟨Bz⟩). The red solid line shows the best fit. From the linear fit we obtain ⟨Bz⟩ = −1477 ± 95 G. In the bottom right panel, we present the same as in the bottom left panel, but for the null profile (i.e. ⟨Nz⟩). From the linear fit, we obtain ⟨Nz⟩ = 30 ± 64 G. |
| In the text | |
|
Fig. 2 Variation of the ⟨Bz⟩ value obtained for HD 345439 from the analysis of the hydrogen lines (black asterisks) and of the whole spectrum (blue rhombuses). Between each point is a time span of about 22 min. |
| In the text | |
|
Fig. 3 Left-side panel: Stokes V spectrum of HD 345439 in the vicinity of Hγ and He iλ4471 obtained from combining the first two subexposure pairs. The shape of the Zeeman features indicates a longitudinal magnetic field of positive polarity. Right-side panel: Stokes V spectrum of HD 345439 in the vicinity of Hβ and He iλ4922 lines obtained from combining the last two subexposure pairs. The shape of the Zeeman features indicates a longitudinal magnetic field of negative polarity. |
| In the text | |
|
Fig. 4 Line profile variability of Si and He in the FORS 2 Stokes I spectra of HD 345439 obtained for each subexposure pair, i.e. with a time lapse of 22 min. The top panel presents the behaviour of the Si iii λ4553 line. The mean profile is indicated by the red dashed line. The numbers close to the plotted line profiles refer to the time of the observation calculated as MJD-56 810. The vertical bar on the left side shows the noise level. In the bottom panel we present overplotted profiles of the He i λ4388 and He i λ4471 lines. Their intensity is lower at the phase when the polarity of the field is positive and increases when the field is negative. The error bar is too small to be presented in these plots. |
| In the text | |
Current usage metrics show cumulative count of Article Views (full-text article views including HTML views, PDF and ePub downloads, according to the available data) and Abstracts Views on Vision4Press platform.
Data correspond to usage on the plateform after 2015. The current usage metrics is available 48-96 hours after online publication and is updated daily on week days.
Initial download of the metrics may take a while.